Adjusted Save Percentage: Measuring the Impact Defense has on Goaltending Statistics


From our friends at NHLNumbers.com :
Written By: Money Puck (@MoneyPuck_)
One of the reasons we love sports as much as we do is because of the great debates it can spawn. I came across a classic hockey debate the other day in relation to Ryan Miller. “Of course Miller didn’t post elite numbers last year. He played for Buffalo!”
As I was thinking about this, it struck me that while we have made huge strides in advanced statistics overall, we haven’t made much progress in terms of quantifying the impact of defense and separating that contribution to statistics for the goalie themselves. We can tell the percentage of shots a goalie save (SV%), but we have little to no insight into the difficulty level of the shots themselves.
From a quantitative standpoint, we understand the game better now than ever before. We understand shot attempt differential, which we know we can be used to approximate possession. We call this corsi, and we understand this to be a key component of overall team success. We can also begin to isolate the impact a player has on their team’s shot attempt differential, which is a solid representation of strong two way play.
However, there is one factor that detractors of advanced stats have always struggled with. Detractors have long protested that not all shots have an equal chance of going in, and they’re right. Is it possible to adjust save-percentage to reflect easier or more difficult workload? Find out after the jump.
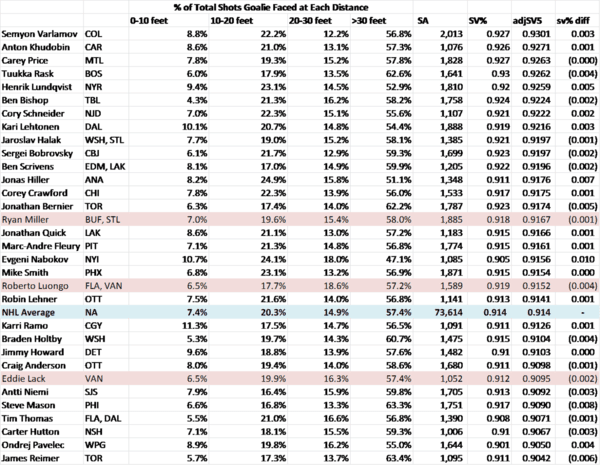
In the 2013-14 season, goalies league wide faced 73,614 shots. Using Greg Sinclair’s immensely useful website we can break shot attempts down by the distance the shot was taken from the net. As you would expect, shots taken from within 10 feet, such as rebounds, redirections, cross crease feeds, and other scoring chances, have the highest shooting percentage at 19%. This shooting percentage is over 4.5 times higher than shots taken outside 30 feet, but shots from here are significantly more rare (only 7% of total shots).
TABLE 1
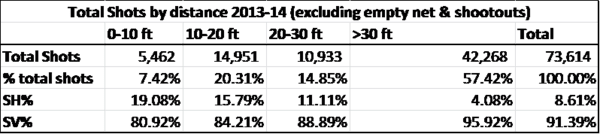
This confirms something we’ve always known: not only is the goal of defenses to limit shot attempts (which we can measure with corsi), but perhaps just as importantly, limit the chances the other team gets in high percentage areas. Based on the information above, a shot from inside 10 feet from the goal is almost five times as likely of finding the twine than a shot from 30 feet out. Naturally, some defensemen do a better job of clearing the puck from high percentage areas than others, and we can use this data to calculate how much of a goalies save percentage is the result of having a better or worse defense in front of them.
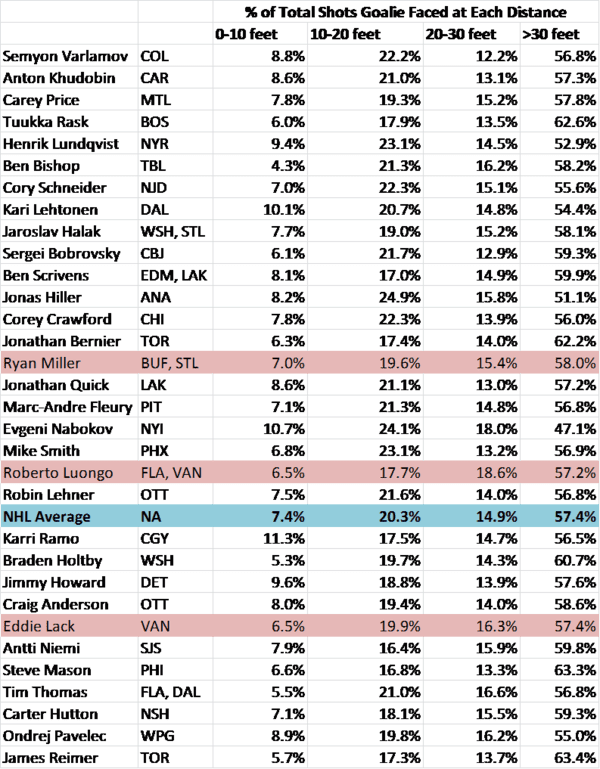
Here is the distribution of shots faced for each goalie who played over 1,000 minutes in 2013-14:
TABLE 2
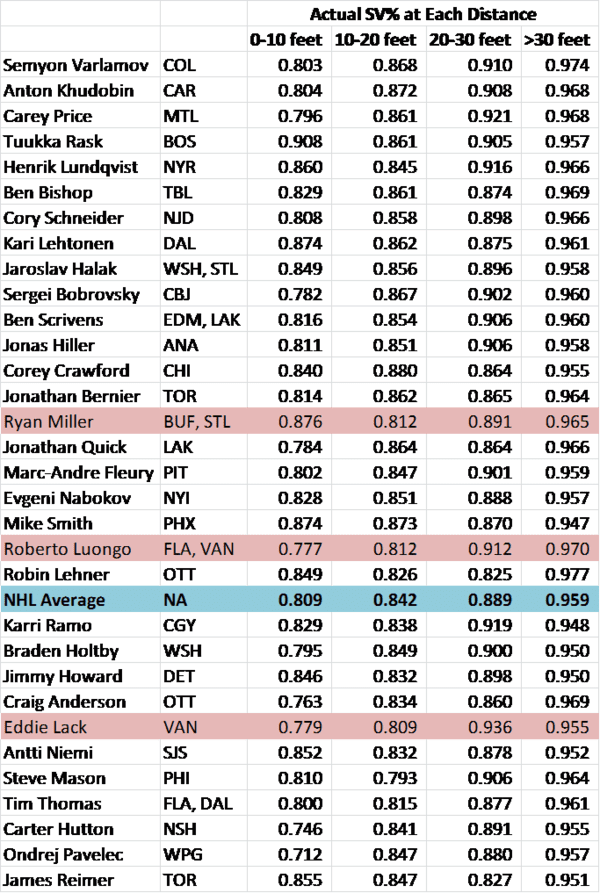
My next step was to calculate each goalie’s save percentage for each of the four distances:
TABLE 3
Then in order to isolate the impact of team defense, I applied the redistributed the total shots faced by each goalie by the average shot distribution at each of the four distances, then used the goalies actual save percentage at each distance to calculate an adjusted save percentage (excluding empty nets and shootouts):
TABLE 4
Now before I get into discussing the result, there are obviously limitations of this approach which are worth noting. Using the four distance buckets obviously runs the risk of overly aggregating shots that are dissimilar. For example, a goal mouth rebound from two feet out likely has a much higher chance of going in than a shot from nine feet out where the goalie has position. In the future, as we track more variables such as whether the shot is coming of a rebound or a one-timer, or even shot velocity, I could envision a much more complex version of this approach. There are also issues with inconsistencies in today’s data gathering when it comes to shot distance data from one arena to the next. In short, this isn’t perfect by any means.
Detractions aside, I think the data above provides an interesting glimpse into the varying levels of difficulty each goalie faced. Lack, Miller, and Luongo, all faced a lower proportion of shots in the 0-10 foot and 10-20 foot categories than the league average, meaning that the defenses in front of them did a better than average job of limiting the amount of high percentage shots they faced from in close.
A number of other interesting data points jump off the page. For instance, Steve Mason enjoyed a renaissance season in Philadelphia last year, but when you adjust for shot distribution you find that his adj SV% at .909 was actually right in line with his career SV% of .907. Sorry Philly fans, you still may not have solved your goalie problems.
On the other end of the spectrum, Jonas Hiller faced an incredibly difficult shot distribution. When adjusting for shot distribution he went from a SV% of .911 to an adjusted SV% of .918, which was slightly above his career SV% of .916. He signed with Calgary for $4.5M per year, which makes me wonder how much more he could have gotten if teams realized just how much the Duck’s defense hung him out to dry last season.
In the summer of analytics, goaltending has been noticeably absent from the discussions of major areas of advancement in our understanding of the sport we love. While the above approach is somewhat rudimentary based on the limitations of the data we currently have to work with, it very well may turn out to be an area of interest going forward.