How Does Winning Faceoffs Correlate To Winning Games?

One thing that has always bugged me about watching hockey on TV is how the announcers are constantly talking about how important it is for a team to have a player that can win big faceoffs. This usually happens after a player loses a defensive zone draw with ten seconds left in a period and his team gets scored on. I was always unsure just how much effect a top-notch faceoff man has on a game, although I was fairly confident it was not nearly as much as some announcers would have you believe. Let’s take a look at some of the numbers.

Penalty Kill
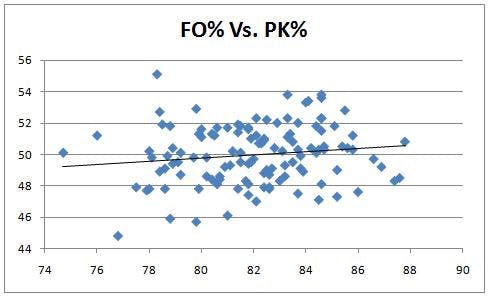
There is a slight upward trend in the data points, but nothing that can be taken seriously. If you were given the faceoff percentage of a team, there is less than a 2% chance that you could apply this information into the formula given by the trendline and predict the team’s penalty kill success rate.
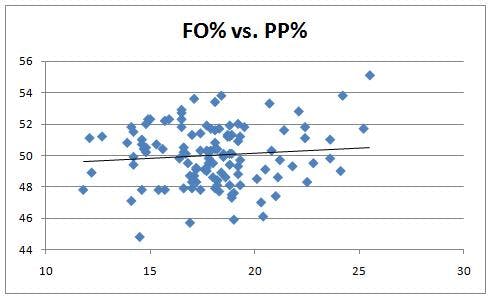
Powerplay
On the opposite end of the spectrum, we have the power play. I graphed the same information, replacing PK% with PP%, and was rewarded with similar results. This time the accuracy was less than 1%.
Five on Five
If faceoff winning percentage does not seem to have an effect on special teams, maybe five on five is where it counts. Let’s graph FO% against every team’s five on five goals for and against ratio.
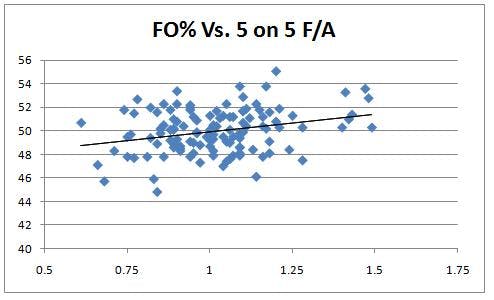
This time around we have a noticeably steeper trend line, and the r-squared is much higher at .079. However, this still is not high enough to be considered statistically significant.
Points
Now that we have looked at the pieces that go into scoring and preventing goals, let’s take a look at overall success. The ultimate sign of a team’s success is measured in how many points (the type they get for winning games not scoring goals) they accumulate over a season. Let’s graph FO% vs. Points.
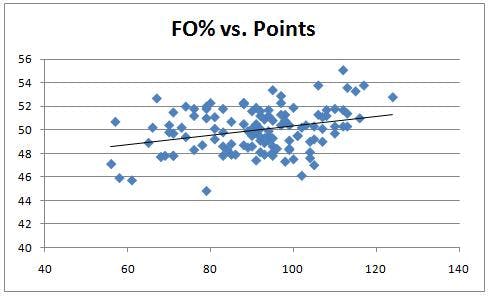
This is actually the most accurate of the four graphs with an r-squared of .097. I wouldn’t take this as proof to a statistician, but I think it is fair to say that it is possible that faceoff percentage can have a small effect on the overall success of a team. Like I said, an r-squared of .097 is not indisputable proof, but there is some degree of truth to what these announcers are talking about. We certainly have not seen a downward sloping trendline in any of these graphs, which would complete negate their argument.
Individual Players
I also decided to look at how faceoff percentage correlated to individual players +/- numbers. Some would argue that guys that are better at winning faceoffs are less likely to get scored on because it allows their team to control the puck for a greater portion of the game. Unless you are Steve Smith, it is generally pretty difficult to get scored on when you are controlling the puck. I decided to take a look at the 170 players over the last two years who took enough faceoffs to qualify for NHL.coms official FO% statistic. However, graphing faceoff percentage against plus minus is not good enough because it does not take into account how many minutes a player is on the ice. I simplified it to +/- per ten minutes of ice time to get a more accurate read.
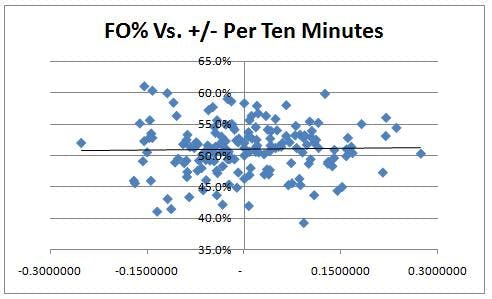
That is a pretty random sample with no significant patterns. This does nothing to prove that faceoff whizzes perform any better in five on five situations than anybody else. If I were an NHL General Manager, which I am not and have no aspirations to be, I would not be signing any of these alleged faceoff masters in the hopes of improving my team.
Also, if you are wondering who that player way out on the left of the graph is, it is 2007-08 Radek Bonk, who was -31while averaging 15:55 minutes of ice time per game. But man was he above average at winning faceoffs!
Conclusion
I think it is fairly safe to assume that you cannot successfully predict the level of success of a team based on faceoff winning percentage, but it certainly does not hurt to know this information. There are so many other factors that go in to winning a hockey game, and I think General Managers who go out and find their faceoff dynamo (who also happen to suck at every other aspect of the game) are just plain nuts.