Should NHL Teams Draft European or North American Skaters In The First Round?

There has always been a very heated debate on whether NHL teams are better off drafting Europeans or North American skaters in the first round of the NHL Entry Draft. Based on my gut instinct, I felt that there were many more high profile European players who turned out to be busts, but did not have any numbers to back it up. I decided to look at every first round from 1995-2004 to find out my answer. I decided on these dates because it would give a large sample size (ten years) and it gives the more recent draftees adequate time to prove themselves, but does not go back so far in time that the early players are not relevant. I would suggest reading on; you may be very surprised by the results.
Forwards
I split up the draftees into forwards and defenceman because the production expectations in terms of points are very different for the two positions. Let’s take a look at the results for the forwards.
There were 100 North American skaters drafted at an average position of 14.66. The Europeans were drafted a bit higher, with 70 players selected at an average position of 13.30. Naturally, we might suspect the Europeans to hold a slight edge because of this, but that is a topic for another day.
North Americans
As of the conclusion of the 2008/09 season, the North American forwards have combined for 31,548 games, 7,571 goals, 10,423 assists, 17,794 points and 22,216 PIMS. The average playing career thus far of these guys is 315 games, 76 goals, 104 assists, 180 points and 222 PIMS. The stat I have chosen to focus on is point per game because it is the most indicative of a player’s talent level. The North American forwards averaged .572 points per game.
Europeans
As of the conclusion of the 2008/09 season, the European forwards have combined for 17,423 games, 4,437 goals, 5,931 assists, 10,368 points and 9,622 PIMS. The average playing career thus far of these guys is 248 games, 63 goals, 85 assists, 148 points and 137 PIMS. This means Europeans forwards averaged .595 points per game, slightly higher than their North American counterparts! This could be explained by the slightly higher drafting position, but that is unlikely in my opinion.
Some Alternative Theories
So as we can see, the North Americans had longer careers and produced more points, but on a per game basis, the European players were more effective. I have a theory for this, and it is that more North American enforcers are drafted than Europeans. Let’s take a look at the point per game production of the top 50% of players (in terms of total points) from each segment. The North Americans averaged .643 points per game, while the Europeans averaged .646. Nope, that theory fell through too.
Another argument that some would make is that Alex Ovechkin and Evgeni Malkin skew the results thanks to the high point per game totals they have produced thus far in their young careers. This is only partially true. If we remove these two players from the European data, the point per game average falls to .572, EXACTLY the same as the North Americans. However, if we look at the following graph, we can see that Ovechkin and Malkin are not nearly the outliers people think they are. I have graphed points (Y-axis) versus games played (X-axis) for every European forward, with those two highlighted in red.
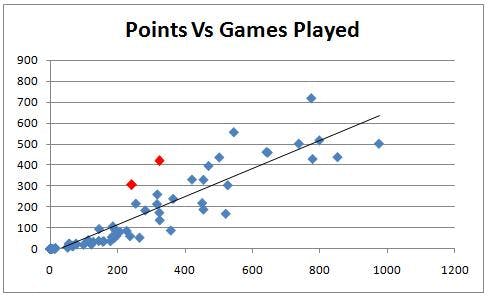
Also, if we do this, it is only fair to remove the North American “outliers”, which are Dany Heatley, Jason Spezza and Joe Thornton. Since there were 43% more North Americans drafted, it is only fair to remove 43% (well 50% technically) more players. If we do this, the North Americans drop to .545 points per game, and even greater decrease than the Europeans. As we can see, the two European exceptions (Ovechkin and Malkin) have less of an impact on the data than their North American counterparts. Here is the North American data set, with the three “outliers” in red.
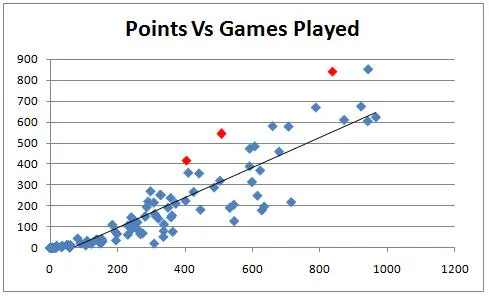
My final comment about the forwards is with regards to the previous two graphs. As we can see, the pattern in the data between the two data sets is very similar, and the trendline is almost identical. This means that you could expect a similar career no matter what the player’s nationality. It is not like the European contingent consisted of a bunch of busts that never made the NHL and a bunch of superstars. In fact, the Europeans were more consistent and had a smaller standard deviation in terms of career points.
Overall, I do not think that this is enough proof to justify taking a European over a North American skater, and the skill set and projections for each individual player is more important. However, I think it is interesting and may help debunk what I believe is a fairly common myth.
Defenceman
We are not done yet! It is time to take a look at the defenceman. There were 60 North Americans drafted at an average position of 15.4, and 26 Europeans at an average position of 15.8. As we can see, the ratio of North American defenceman drafted relative to Europeans is much higher than with the forwards.
North Americans
As of the conclusion of the 2008/09 season, the North American defenceman have combined for 18,917 games, 1,310 goals, 4,296 assists, 5,606 points and 18,030 PIMS. The average playing career thus far of these guys is 315 games, 22 goals, 72 assists, 94 points and 300 PIMS. This equals a point per game average of .296.
Europeans
As of the conclusion of the 2008/09 season, the European defenceman have combined for 7,384 games, 411 goals, 1,421 assists 1,832 points and 6,111 PIMS. The average playing career thus far of these guys is 284 games, 16 goals, 55 assists, 71 points and 235 PIMS. This equals a point per game average of .248.
The fact that the North American players held such a distinctive advantage came as a bit of a surprise to me considering that European defenceman are generally regarded as skilled puck movers and offensive players. Obviously, the North Americans have the advantage in this category.
+/-
However, scoring points is not the end of the story for defenceman. Many defenders are employed not to put the puck in the other team’s net, but to keep the puck out of their own.
Overall, the North American defenceman have a cumulative +/- of -193, or -.84 for every 82 games played. This was helped by a crop of recent good young defenders; the 37 players drafted before 2001 are -300 for their careers. If not for Wade Redden (+154) and Chris Phillips (+100), things would be much worse. Not an impressive outing for the North Americans.
If you can believe it, the Europeans were even worse. They were a cumulative -81, which resulted in an 82 game +/- of -.90. I find it very hard to believe that the defenceman drafted in the first round over a ten year period have a negative career +/-. These guys are supposed to be the cream of the crop, but I guess the numbers do not lie.
As we can see, General Managers would be better off drafting North Americans in the first round with regards to defenceman. They had longer careers and produced better on a per game basis than their European counterparts. However, the standard deviation for the North Americans in +/- was almost twice as high, meaning there was a greater possibility of getting a star, but also a bum. In a sense, this makes them the riskier option.
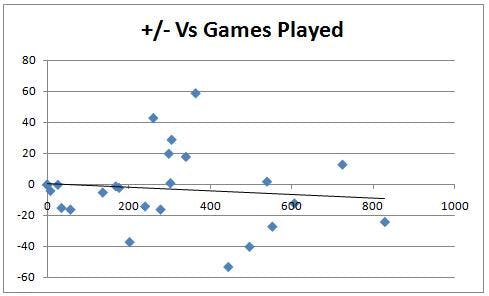
I also have one last interesting note on the Europeans. I plotted +/- versus games played for each player, and was rewarded with the following graph. As you can see, the downward sloping trendline indicates that the more games a defenceman plays, the worse his +/- is expected to be. For you statistically savvy readers, you can probably guess that the r-squared was miniscule, but I thought it was interesting nonetheless. I have no idea why these guys keep getting ice time when the goal of the sport is to score more goals than you allow.
Conclusion
While I probably would not bring this information with me on draft day and use it to make my decisions, I think it provides valuable insight into the comparisons between North American and European players. The popularity of Europeans has increased in recent years (only 26 of the 118 players drafted from 1995-99 came from across the Atlantic), and for good reason. They provide just as much production as North Americans, and can bring a new dynamic to a team with their style of play. However, we may see this change in the near future due to the lack of transfer agreements between the NHL and Russia, as well as the emergence of the KHL. NHL teams may be hesitant to draft players that could be just as happy to play professionally in Russia.
I hope you have enjoyed my analysis, and that it provides you with some ammo when the discussion inevitably comes up with your friends.