The Cheat Sheet: December 15th, 2010


If you’re looking over the NHL betting board and want an unbiased second opinion, then scroll on down to the Cheat Sheet. A very busy computer crunched a bunch of numbers from this season and the last to produce an analytical summary of the day’s available bets. Do the numbers match with your opinions, or do they throw your predictions for a loop?
Scroll down to find out.
—
INDEX:
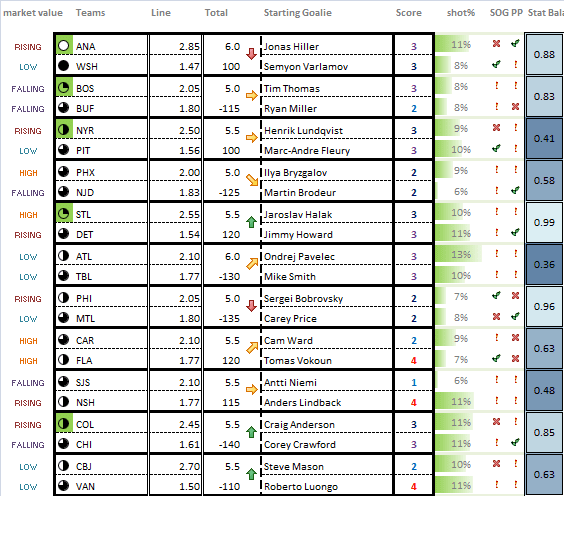
market value: This is a gauge of the team’s general play-on value. Teams that are rated ‘HIGH’ are often underrated by the betting public, and are also likely to improve on their current form. Teams that are ‘RISING’ are not likely to improve on current form, but are still offering some good betting value. Teams that are ‘FALLING’ are underperforming and not offering good value in their betting lines. Teams that are rated ‘LOW’ are being bet strongly by the betting public and are also likely due to regress from current form.
Circles: The circles indicate the strength of the play on the side relative to the other available plays on the day. A white circle indicates a highly recommendable play on the day, whereas a black circle indicates a highly not recommended play. Circles highlighted in green represent the most highly recommended plays on the day. Plays are recommended based on a team’s projected chances of winning, the line value in a team’s betting odds, and also the reliability and availability of statistics to support the recommendation (see ‘Stat Balance’).
Arrows: The arrows indicate whether the prediction favors a play on the Over or the Under. Upward arrows point to the Over, and downward arrows point to the Under. Horizontal arrows are neutral.
Score: Projected to be the most-likely score for the game. The numbers are color-scaled red-purple-indigo-blue, with red being the highest and blue being the lowest.
shot%: This is the average of the team’s projected shot percentage and the opponent’s projected save percentage.
SOG: This is a gauge of how many shots on goal a team is projected to have. A checkmark indicates a more than average amount, an exclamation mark indicates an average amount, and an “X” indicates a below average amount.
PP: This is a gauge of how well the team’s PP is projected to do against the opponent’s PK. A checkmark indicates above average, an exclamation mark indicates average, and an “X” indicates below average. The amount of PP opportunities that the team is likely to receive is also factored in, so if the team’s opponent is discipline, then success on the PP will be projected to be less likely.
Stat Balance: This is used as a gauge of how reliable the statistics used in the prediction are. The system uses statistics from both teams’ records, but it is rarely perfectly balanced, due to differences in situational games played. The closer this number is to 1.00, the more balanced the stats are for this prediction.
—
Wednesday’s Cheat Sheet: (goalies and odds as of 2:00 AM ET)
An opinion or two:
– What has happened to the Washington Capitals? They’re still averaging about 1000 shots per game, but none of them are going in anymore. Of course, most of us are still too afraid to bet against them.
– Boston Bruins +105 would be my favorite pick. Nothing against Buffalo, but the numbers are kind of stacked against them. The Sabres have a tendency to lose games following games in which they get beat down on the scoreboard (I guess they need the extra game to recover).
– A little warning about the COL/CHI game. I’ve noticed that the back-end of home-and-homes tend to produce results that are opposite to the first game. Colorado won the first game NHL Arcade style, so the second game (in theory) should be a low-scoring Chicago win.
—