The Cheat Sheet: December 6th, 2010


If you’re looking over the NHL betting board and want an unbiased second opinion, then scroll on down to the Cheat Sheet. A very busy computer crunched a bunch of numbers from this season and the last to produce an analytical summary of the day’s available bets. Do the numbers match with your opinions, or do they throw your predictions for a loop?
Scroll down to find out.
—
INDEX:
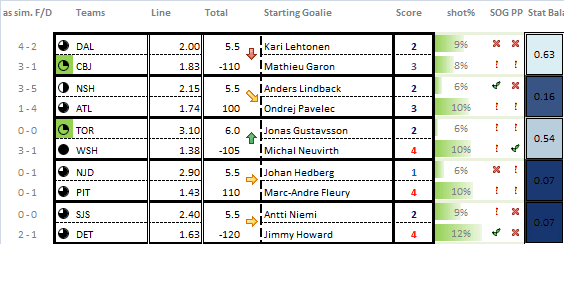
as sim. Fv/Dg: This is the team’s record this season as a similar-sized favorite/underdog.
Circles: The circles indicate the strength of the play on the side relative to the other available plays on the day. A white circle indicates a highly recommendable play on the day, whereas a black circle indicates a highly not recommended play. Circles highlighted in green represent the most highly recommended plays on the day. Plays are recommended based on a team’s projected chances of winning, the line value in a team’s betting odds, and also the reliability and availability of statistics to support the recommendation (see ‘Stat Balance’).
Arrows: The arrows indicate whether the prediction favors a play on the Over or the Under. Upward arrows point to the Over, and downward arrows point to the Under. Horizontal arrows are neutral.
Score: Projected to be the most-likely score for the game.
shot%: This is the average of the team’s projected shot percentage and the opponent’s projected save percentage.
SOG: This is a gauge of how many shots on goal a team is projected to have. A checkmark indicates a more than average amount, an exclamation mark indicates an average amount, and an “X” indicates a below average amount.
PP: This is a gauge of how well the team’s PP is projected to do against the opponent’s PK. A checkmark indicates above average, an exclamation mark indicates average, and an “X” indicates below average. The amount of PP opportunities that the team is likely to receive is also factored in, so if the team’s opponent is discipline, then success on the PP will be projected to be less likely.
Stat Balance: This is used as a gauge of how reliable the statistics used in the prediction are. The system uses statistics from both teams’ records, but it is rarely perfectly balanced, due to differences in situational games played. The closer this number is to 1.00, the more balanced the stats are for this prediction.
—
Monday’s Cheat Sheet: (goalies as of 2:00 PM ET)
An opinion or two:
– Stat balance is terrible today. Not enough situational data for Nashville, New Jersey, and San Jose. The predictions for these games still look reasonable though.
– If you’re willing to make a bet that is expected to lose 64% of the time, but still has positive expected value, then the Leafs +210 is the bet for you. Don’t cry if they get blown out though.
– There seems to be a little bit of value with Nashville. The Preds are 7-5 this season as a road dog, while the Thrashers are 2-4 this season as a home fave. This could also be a letdown spot for Atlanta after grabbing a win in Washington on the weekend.
– I switched in Mathieu Garon for Steve Mason this morning, and the prediction flip-flopped. Garon has been better than Mason this season, but the team is clearly not doing either goaltender any favors lately with their porous defense. This is a wait-and-see spot for me, rather than a play-on spot.
—