Adjusted Plus-Minus: Measuring Defensive Effectiveness


From our Friends at camucksarmy.com
Written By: Money Puck (@MoneyPuck_)
Most people in the stats community dislike plus-minus, but my feelings are much stronger than that. I loathe plus-minus. It’s personal. The draft for my keeper league hockey pool was about to start and I was considering taking a flyer on a young Erik Karlsson. He was coming off his 2nd season in the NHL, where he posted an impressive 45 points. However, at minus 30 I figured he must be in for a significant drop in playing time considering he was obviously such a huge defensive liability to his team. Karlsson ended up finding himself on the roster of my arch nemesis, scored an insane 78 points, and hilarity ensued. I hate plus-minus.
In theory, plus-minus should be an immensely useful stat. The team who scores the most goals in a game wins, so by extension it seems to make sense that better defensive players would be on the ice for more goals for than goals against. Unfortunately, because this statistic is so greatly affected by goaltending and team’s on-ice shooting percentage, amongst other factors, the usefulness of plus-minus is negligible and it has been largely abandoned by the stats community.
This got me thinking: while we know plus-minus itself is a useless statistic, is there a way we could more accurately calculate the impact a player has on their terms scoring differential? Or put more simply, can we create a better plus-minus? Read past the jump to find out.
In my last post I discussed how the proportion of shots a goalie faces from various distances can have an impact on their save percentage, which led me to the conclude that some goalies really do have easier jobs than others based on the quality of defense in front of them. This led me to another question. Can we use shot distance data, together with corsi, to isolate better or worse defenders?
To do that, I started to look at the proportion of shots against various Canuck defensemen faced at even strength. In my evaluation of goaltenders in the prior post, I included shots in all situations which the exception of shootouts and empty nets. A shot from 15 feet out is in theory just as easy or difficult for a goaltender to stop whether it’s a power play or even strength, and I wanted to have the benefit of the larger sample.
However, when evaluating the role of defensemen in their attempt to limit shots from higher percentage areas, I felt it was important to evaluate even strength shots only, so as to avoid skewing the data by having defensemen who play more or less short-handed minutes. It should be more difficult to limit shots from more favorable distances when short-handed.
Here is the breakdown of shooting percentages by distance from 2013-2014 (5 on 5 only):
TABLE 1
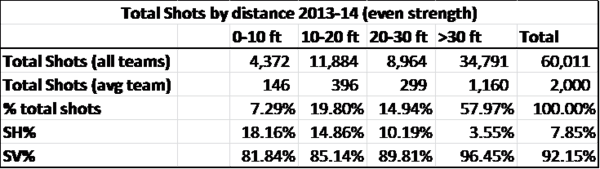
Noting the high shooting percentages when shots are taken inside 20 feet, you can infer that an effective defenseman is not only one that limits shot attempts against his own team, but also one that minimizes the amount of shots taken from these higher percentage distances. Note that I’ve introduced the concept of the average NHL team, which is calculated as the total shot attempts against at 5 on 5 for all teams in the league divided by 30 teams. This concept allows us to estimate many shots an average NHL team would face at each distance and how many of those shots an average NHL goaltender would stop. With that in mind, here are the shot against distribution of the current Canucks defense core:
TABLE 2
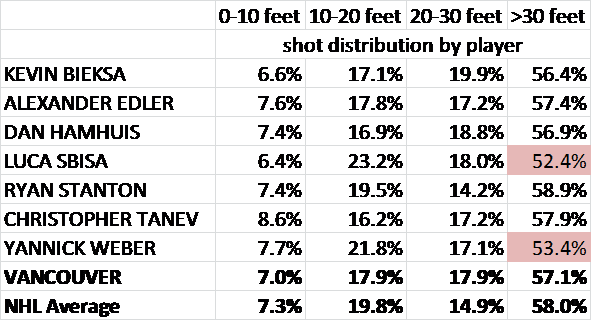
In theory, the better job a defensemen could do in limiting the amount of close-range, high percentage shots, the more positive the impact that defensemen would have on goals against. Looking at the table below, the two defensemen with the lowest percentage of shots further away than 30 feet were Luca Sbisa and Yannick Weber, which seems to correspond well with my opinion as to who are the weakest Canucks defensive defensemen. So far, so good.
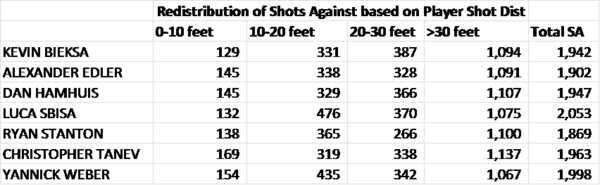
My next step was attempting to see whether we could use this data to estimate each defenseman’s contribution to goals against as compared to an average NHL team. To do so, I took the average shots faced by an NHL team at even strength (see table 1) then adjusted this figure for each player’s even strength corsi to estimate the shots a defensemen’s goalie would face based on how strong a possession player the defensemen is:
TABLE 3

I then distributed the shots against based on each player’s shots against distribution from each of the four distances from table 2:
TABLE 4
I then applied the NHL average save percentages by distance from Table 1 to estimate the amount of goals a team would allow after adjusted for the defensemen’s possession (ie corsi) and shot distribution, assuming the defensemen were to play 100% of the team minutes:
TABLE 5
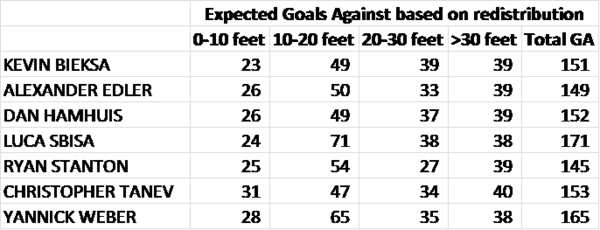
Again we see that Sbisa and Weber were by far the weakest members of the defense corps, while the remaining team members were within a relatively tight band from each other in terms of estimated goals allowed.
This was getting interesting, but how do these numbers compare to an average NHL defensemen? To figure this out, I took the average NHL team shots against, average NHL team shot distribution, and average NHL team save percentages by distance (table 1) to calculate the amount of goals against an average teams defensemen would allow. I then compared this figure to the goals against estimates for the Canucks defensemen in Table 5 to calculate how many more goals the Canucks defensemen to prevent or allow versus average:
TABLE 6
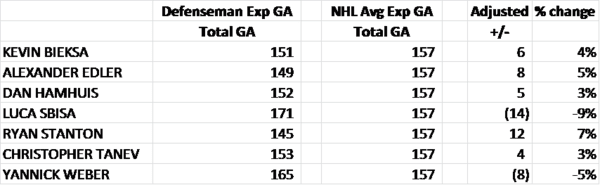
Now this is getting interesting. Assuming Ryan Stanton were to play 100% of the even strength minutes for an average NHL team, they would have 12 fewer goals against, or a 7% reduction in goals against at even strength. Conversely, if Sbisa were to play 100% of the even strength minutes for an average team, they would let in 14, or 9%, more goals. Sbisa should not play 100% of the minutes for an NHL team, in case you were wondering.
The final litmus test for this methodology I decided to do was to add some well-known NHL studs and duds to the mix:
TABLE 7
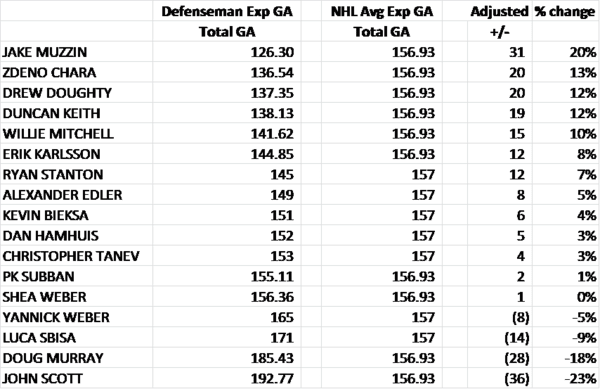
(Editor’s note: holy crap Jake Muzzin)
Conclusion:
So what’s wrong with this adjusted plus-minus? Well, there are a few things. Like Corsi itself, adjusted plus-minus is impacted by quality of teammates, quality of competition, and zone starts. Shot distance data is further plagued by its own set of inconsistencies as purportedly shot distance tracking can vary from one arena to the next, and of course there is the issues with aggregating shots in the 0-10, 10-20, 20-30, and +30 foot buckets. A shot from 2 feet out is likely to have a higher shooting percentage associated with it than a shot from 9 feet out.
Despite the limitations this framework has today, I believe there are insights that can be learned from this. While we know that puck possession is a critical factor which correlates well with team success, we also know that not all shots have the same likelihood of ending up in the back of the net. Finding a way to quantify both the ability of a defensemen to clear the puck from danger in high percentage areas as well as they’re ability to drive possession may be a start to truly being able to quantify the value of the defensive contribution.
Limitations aside, if this framework were to help a team find the next Ryan Stanton, then it just may be worth paying a little attention to.