Adjusted Scoring: How it works and why it matters


Scoring in the NHL has ebbed and flowed across history. As hockey fans, we understand this. When a 1980s highlight reel is aired, our eyes tell us that goals were easier to come by. “Connor Hellebuyck would never let that in.” When it’s mentioned that Jamie Benn won the 2015-16 Art Ross Trophy with 87 points, we recognize that goals were scarce. The sheer size of the gap from the NHL’s offensive peaks to its floors, however, is difficult to fully comprehend.
Consider the Folignos.
I’m uniquely aware of this first-class family with our mutual roots to Sudbury, Ontario. Mike, a 15-year veteran power forward, retired in 1994. His eldest son, Nick, a rugged and respected leader, is nearing the end of his own NHL journey. To compare the two, here are their stat lines through 15 seasons.
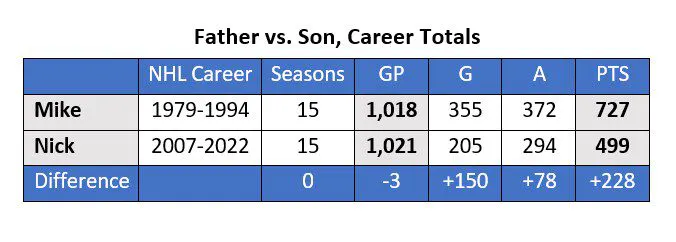
By a whopping margin of 228 points, Mike waxes Nick as the family’s No. 1 scoring threat. Sorry, Marcus. 228 points is a half-decade of production for a solid NHL forward.
30-goal seasons? Mike wins 5 to 1.
60-point seasons? Mike again, 5-1.
Career high in points? Mike 80, Nick 73.
We get it, Dad. Quit showing off! By every possible measure in the NHL’s accounting of offensive performance, Mike comfortably grades as a superior scorer to Nick. It’s not particularly close… at first glance.
To say Mike’s career began at a favorable time for scoring is an extreme understatement. It’s kind of like saying the Toronto Maple Leafs are due to win a Stanley Cup. Mike played in the greatest offensive paradise an NHL player with scoring punch could hope to call home. As for Nick, well, try as he may to keep up to his old man, he had no chance in this intergenerational faceoff. Let’s dive into why this is the case.
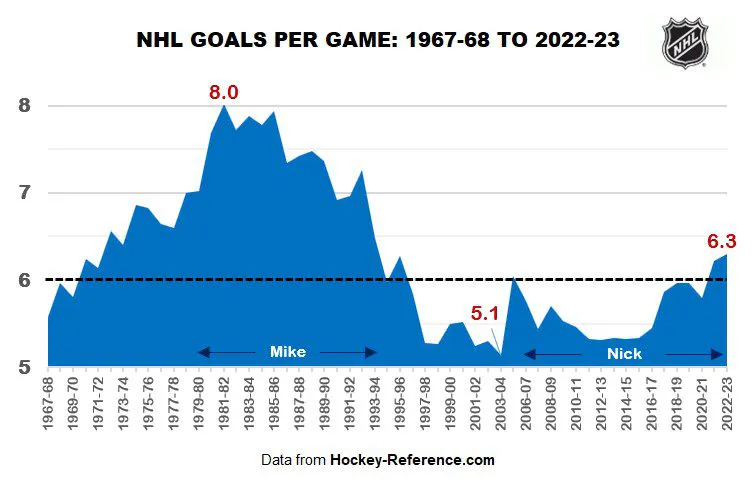
Charted above is the NHL’s goal scoring timeline since the 1967 expansion. The dotted line is at six goals per game, a rough average of a typical NHL contest in league history. We’ll call that six goal mark a neutral scoring environment – no advantage or disadvantage to playing in such a season.
Throughout his career, Mike could expect to see between seven and eight goals a night. In fact, every single season of the 1980s still comprises the top 10 list of easiest scoring environments of the last 77 years.
Every. Single. Season.
This is not to say scoring an NHL is goal is ever easy. This is the world’s best hockey league, and I’ve scored zero NHL goals. I suspect you have too.
But relatively speaking, Nick Foligno’s NHL has been an offensive graveyard. So much so that the ghost of Jean-Sebastien Giguere’s oversized gear is rumored to still haunt Nick’s locker room stall. It took until he was 34 years old for the former Blue Jackets captain to play in a season where the NHL averaged six goals per game.
Why Does It Matter?
A dollar in 1985 does not equal a dollar today. A Canadian dollar does not equal an American dollar. Just ask the mid-1990s Winnipeg Jets and Quebec Nordiques. Still too soon, I know.
Goals are hockey’s currency.
The value of a goal is intrinsically linked to how many are scored. Why was early pandemic toilet paper so valuable? There just wasn’t a lot to go around. So, while a goal may hit the scoreboard or get added to the back of a hockey card in the same way 30 years apart, its value fluctuates dramatically.
When we look to other sports, we don’t consider a Steroid Era home run by Barry Bonds equal to a Deadball Era home run by Ty Cobb. Same for a Larry Bird three-pointer and a Steph Curry three-pointer. A good month of long-range shooting by Curry betters a league-leading season for Larry Legend. Why pretend a goal is a goal then?
Let’s illustrate using the celebrated 50-goal and 100-point milestones – exclusive benchmarks reserved for the all-time greats. Right?
Hmm, about that. Was it exclusive at the turn of the millennium? Yes, to say the least. Hitting either mark made you the best male scorer in the world. Jarome Iginla’s 52 goals and 96 points led the league! In 1992-93? Being the 20th-best point scorer in a 24-team league is fantastic. But it’s more a footnote to hockey history than a hallowed feat.
The moral of the story?
Context matters.
We need to evaluate players on a level playing field.
Adjusted Scoring
Incredibly, the peak offensive season in Mike Foligno’s career (1981-82) featured about 150 percent of the offense of the stingiest season of Nick’s (2012-13). Nick would need to get around three points to keep pace to every two points notched by his dad in those respective years. It’s time to make this a fair fight.
Hockey Reference has already done the leg work for us to neutralize every NHL season in history. While there’s no perfect way to do it, their methodology is practical and effectively brings each year on equal footing. It’s an approach I wholeheartedly endorse and have leveraged and built upon at Adjusted Hockey.
So, how does it work?
In the simplest terms, adjusted scoring neutralizes each season to an environment of:
- Six goals per game
- 10 assists per game
- 82 scheduled games
- 18 skaters on a roster
For example, Nikita Kucherov’s league-leading 128 points in 2018-19 were recorded in nearly the exact scoring environment described above. As a result, Kucherov is credited with 128 adjusted points for his work. Those same points in offense-starved 2003-04 equate to 148 points. In the red-light realm of 1981-82, they’re worth only 95 points. A couple decades apart, the same feat swings by 53 points!
Two Generations of Folignos
Let’s bring some perspective to the careers of our favorite father-son duo, born 28 years apart,.
We’re wiser now. We appreciate the seismic gap in scoring climates. We understand that if you played in the 1980s, your scoring is, quite frankly, highly overrated. Conversely, we understand that if you played between the mid-1990s and 2021, your stat line is severely understated. Let’s get to the big reveal.
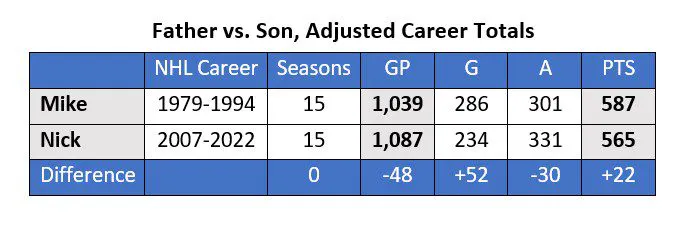
Well, well, well. Mike’s long-running dad strength has taken a hit.
First, Nick gets full credit for the abbreviated lockout and pandemic seasons. More importantly, bringing the pair to the same offensive environment shrinks that 228-point gap to a measly 22 points over 15 years!
Suddenly, their careers are similar. Sure, Mike’s goal scoring has more value than Nick’s assists, regardless of what your first hockey coach told you. But via 15 seasons of point production, these guys are in the same class. Expressed over 82 games (a stat I call Adjusted Pace), we get Dad at 46 points per year, and Son at 43 points. What was previously a massive 19-point gap PER SEASON is now a modest 3.7-point difference.
When revisiting their best individual years, Nick takes the lead, 81-63. This only makes sense – Nick was 10th in NHL scoring in his top season, and Mike was 31st. Yet, to the untrained eye, it looks like Mike had the better season. This is the power of context and adjusted scoring. We can compare players from different generations – in this case in the same household – in an accurate way.
Bringing It All Together
No matter the era, there is more to hockey than numbers and statistical context. We can’t measure the thrill of an overtime winner in a packed arena, or the feeling of watching Guy Lafleur’s hair flow on a dazzling rush.
Yet, the Foligno example brings us eye-opening perspective on how critical it is to evaluate players in their own time and place. When we consider all goals equal, we aren’t comparing seasons, careers, or Hockey Hall of Fame cases fairly. Adjusted scoring is not designed to bring down your favorite 1980s offensive star. Rather, it’s a way to objectively shine light on the true value of performance in the day and age it was achieved.
There are entire generations of skaters or goaltenders lost to history simply because of when they played – not how well they played. This is the level playing field that adjusted statistics creates for us. Players like Nick Foligno – and the living legends of his era like Sidney Crosby and Alex Ovechkin – deserve to be measured equitably in history.
With this is mind, we’ll be launching a five-part series to wrap the season. “2022-23’s Greatest Performances: Where Do They Rank in History?” will place this year’s most outstanding feats in proper all-time context. Using adjusted scoring as a weapon and factoring in off-ice considerations, here are the superstar seasons covered in the upcoming week:
- Sidney Crosby & Alex Ovechkin (Thursday, April 6)
- Connor McDavid (Friday, April 7)
- Linus Ullmark (Saturday, April 8)
- Erik Karlsson (Monday, April 10)
- The Best of the Rest: Draisaitl, Pastrnak, Rantanen, Jack Hughes, Boston Bruins (Tuesday, April 11)
Stay tuned!
Paul Pidutti is the creator of the Adjusted Hockey project, which brings context to hockey statistics. His Hockey Hall of Fame methodology, the Pidutti Point Share (PPS) system, is the first comprehensive measure of HHOF worthiness. You can find his work on Twitter (@AdjustedHockey) and adjustedhockey.com.
Adjusted GP & Pace stats from Adjusted Hockey; all other data from Hockey Reference