Bulsink: Using data to review the first quarter of the NHL season and project the remaining schedule


By: Phil Bulsink
The 2021-2022 season is about one quarter of the way done – most teams have played 20-25 games. This is a good opportunity to take a look back and see how the model has done thus far and what teams are over or underperforming their expected points pace.
Pacific Division
The obvious challenge for the model this year was going to be predicting how the Seattle Kraken would do. Many popular models from Twitter use player-based metrics. They’re able to assemble a team as a sum of the players on that team. Most of them predicted around 90 points for the Kraken.
However, the model that we’re using this year for the daily betting posts is composed of team-level stats only. How do you estimate how good or bad a team will be if you have no prior data for that team? The short answer of that question is: take the average attack and average defense strength of the worst half of the league for the past few years. This gave us a prediction of (a measly) 71.8 points, when the season was predicted 100,000 times.
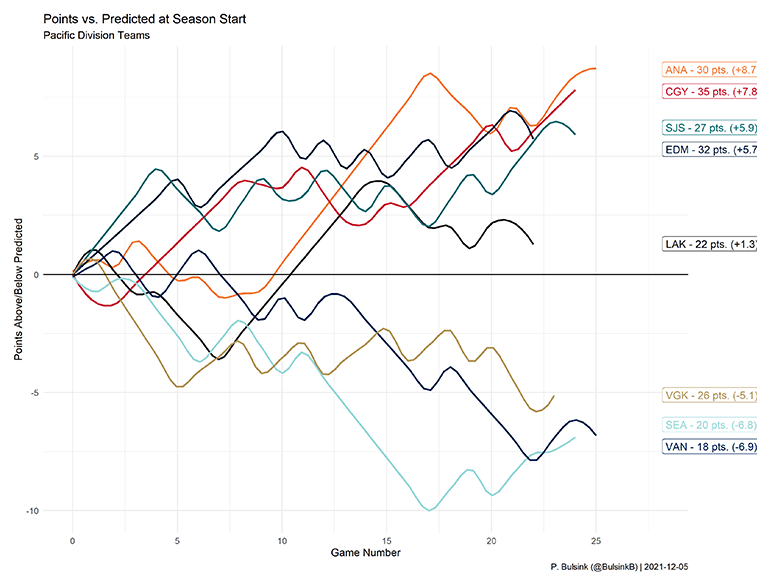
If we look at this plot above, we can see that Seattle is performing below even that expected pace thus far. The Kraken are currently 6.8 points behind where they should be to hit the 72 points predicted by season’s end. They’ve been let down by some goaltending challenges so far, but in the last two weeks things seem to be looking up a bit for them.
To explain these plots a bit more: they show where teams are compared to the expected, so Los Angeles is about 1.3 points above the expected pace with 22 points thus far, while Vegas has had trouble putting a run together and is 5.1 points below pace, despite having 26 points.
By looking at the plot, the things that are clear to see are the struggles that the Canucks have had of late after a steady start, leaving them down at almost seven points below expected.
Anaheim’s big eight-game winning streak (from games 9-17) pops out too, leaving the Ducks more than eight points up above expected, while Calgary’s division-leading points haul thus far has been nearly as far above pace as Anaheim.
Watch to see what happens with them as the season progresses, if they can maintain this pace they’ll look great for a playoff run.
Central Division
The central division is a mixed bag of performance. The Wild have been hot out of the gate and, but for one or two spans, are able to keep the momentum going, especially recently. They’ve overproduced based on their xG values so I’d expect they revert a bit back to their expected performance at some point.
The St. Louis Blues started well too, but got some puck luck as well. They seem to have started to revert toward their expected tally recently, with a bit of a downward slide from their peak around game twelve.
Most of the other teams though… the Jets looked OK for a bit but have fallen recently. Nashville, Dallas, Colorado all coming in around their expected tallies thus far.

On the other hand, although the model didn’t have much hope for Arizona to start, it did have a built-in assumption that the Coyotes would try to get better in the offseason. The tank mode of hockey isn’t understood by the model, so they’ve found themselves nearly 12 points off of the expected pace – and with 12 points in hand they’ve only collected half of what was expected by this point.
Chicago is doing slightly better. The Blackhawks seem to have stopped the bleeding, but will still need a good run to erase the deficit they’ve given themselves.
Atlantic Division
In the Atlantic, there’s one team that has struggled publicly more than any other.
Despite Montreal’s (unexpected) run to the cup final last year, the Canadiens have struggled this year more than the models anticipated. They’ve let go of their GM and it’s a wait and see if some front office changes will turn things around. But at 15 points off pace in just 26 games it’s a hole likely too deep to dig out of.
Let’s not discount the other struggle in the Atlantic – Ottawa has managed to collect only 13 points thus far, four of them in its last two games. They have dealt with COVID more than any other team, but there seems to be some challenges between players and management that don’t foster good performance on the ice. Let’s see if this recent two-game run is going to be the sign of things to come or just a temporary halt to the slide.
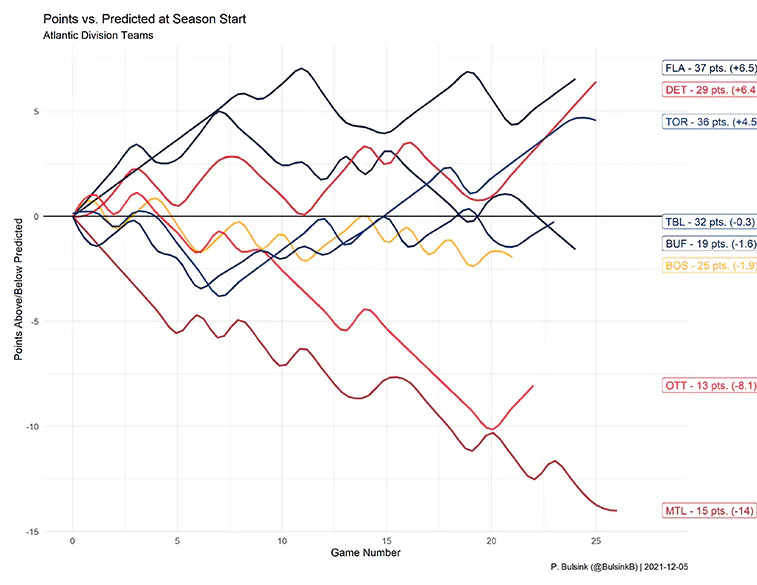
On the upside, though, Florida came out of the starter’s block hot, and have built a solid points base to keep the season going strong. They regularly compete for the Presidents’ Trophy in the model’s season predictions and have set a solid benchmark by which all of the other teams can try to measure themselves.
The Leafs have figured things out after a rough start – but they’re still under their expected goal count so things could get hotter just as easily as they cool off in Toronto.
Buffalo has had the opposite season – the Sabres started hot but have drifted back to where we expected (1.6 points below expected at 24 games).
Detroit is showing some good signs of life this year: the model had expected the Red Wings to get around 80 points, but they’re currently six points up on that – which is a 95-point pace.
Metropolitan Division
Things are looking good here (if you ignore the Islanders).
Sure, Pittsburgh has struggled a bit as it gets its stars back from injury, the Penguins are only 2.6 points off pace with 25 points in the bag, so not awful.
Everyone else is bringing the points in faster than they were expected to. Unless you’re talking about the Islanders. They’ve struggled with COVID in their locker room this year (to the point of having some games postponed) and the lingering effects seem to still be taking their toll. They’ve been under-scoring their xG by a decent bit so far, so if they can get a bit of luck and hit the back of the net, they should be able to turn things around.

Washington sits on top of the standings at 36, points, which 6.6 points above expected, but it’s getting some good puck luck (or is that just the effect of Ovechkin?).
Philadelphia has struggled of late and returned to its expected pace, but if the Flyers can right the ship, they’ll avoid falling too far behind.
Predicted Points
Looking forward to the rest of the season the play for the Presidents’ Trophy and the playoff home-ice advantages are wide open yet.

Florida and Carolina lead the pack in expected standings points by the end of the season – both could easily pass 120 points. Montreal could find itself in last if Ottawa and Buffalo can get a few hot games strung together. Tampa Bay and Toronto are still right behind though, so the top spot is completely up for grabs. There seems to be a marked predicted separation between the top and bottom eight teams – the playoff race this year might be more about securing home-ice advantage and less about whether or not the bottom teams make it in.

In the west, Calgary has eclipsed Colorado at the top of the predicted points pile, but both are likely to come in with fewer points than the top eastern teams. Arizona is cementing its place in the basement, but the unknown yet is Seattle – two weeks ago the Kraken were looking to be worse than the Coyotes, now they’re nipping behind the Kings and the Sharks. The model is still a little sensitive with only 24 game data points for the Kraken compared to a few hundred or thousand for the remainder of the teams.
Regardless of the predictions, there’s lots of hockey to come and no matter what happens on the ice we’ll be treated to some exciting action.