DFO DFS CHARTS – 02/28/23

Welcome to the DFO DFS Charts brought to you by NHL Odds site Betway!
The DailyFaceoff DFS Charts used to be a PREMIUM Tool, but we are now happy to offer them 100 percent FREE!
The charts are posted daily (Monday to Saturday) but usually aren’t available until all NHL lineups have been confirmed (roughly 3:00 PM ET). This year there will be three separate versions of the charts, one for OwnersBox, one for DraftKings, and one for FanDuel. The information is the same, but the site’s pricing differs. The links to these charts will change daily, so you’ll have to get the new links from the current day’s DFS Chart post.
CLICK THE LINKS BELOW FOR TODAY’S CHARTS
➡ FanDuel
HOW TO READ THE CHARTS
Implied Totals
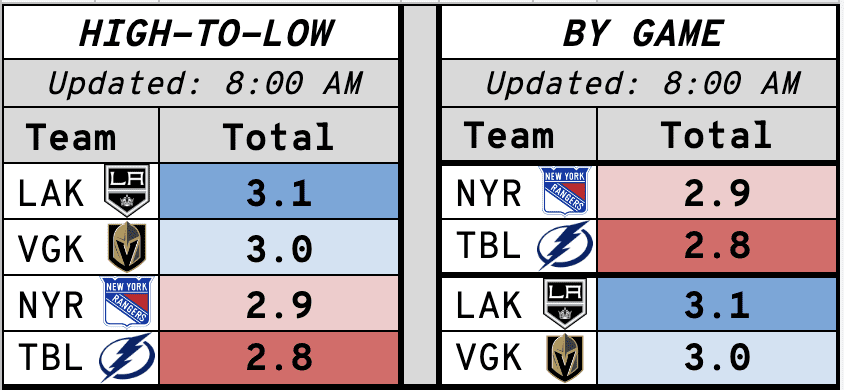
The implied totals for all of the day’s games that are included in the Main DFS Slate. Implied totals are the number of goals each team is implied to score based on Sportsbook’s game line and total. Targetting players on team’s with the highest implied totals is usually a good place to start.
Matchups and Matchup Score
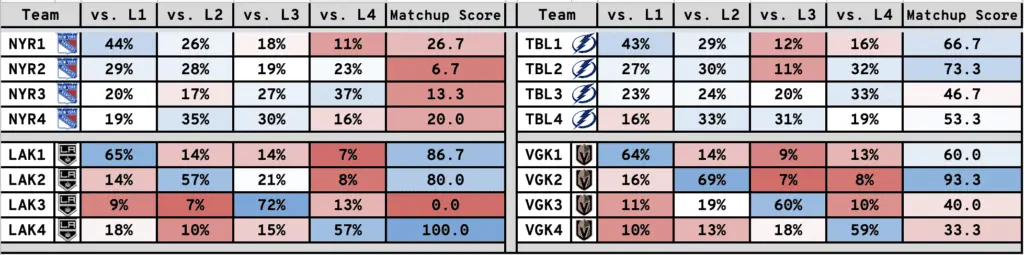
Matchups are based on historical data on how a home team deploys their lines at 5v5. The percentage is the projected percent that each line is expected to face other lines.
The Matchup Score is calculated based on the difficulty of each matchup and the amount they are projected to face each line. Each line’s matchup is weighted against all other matchups on the slate and given a score from 1-to-100, with 100 representing the best matchup for offensive success.
PRESENTED BY BETWAY

Line Stats
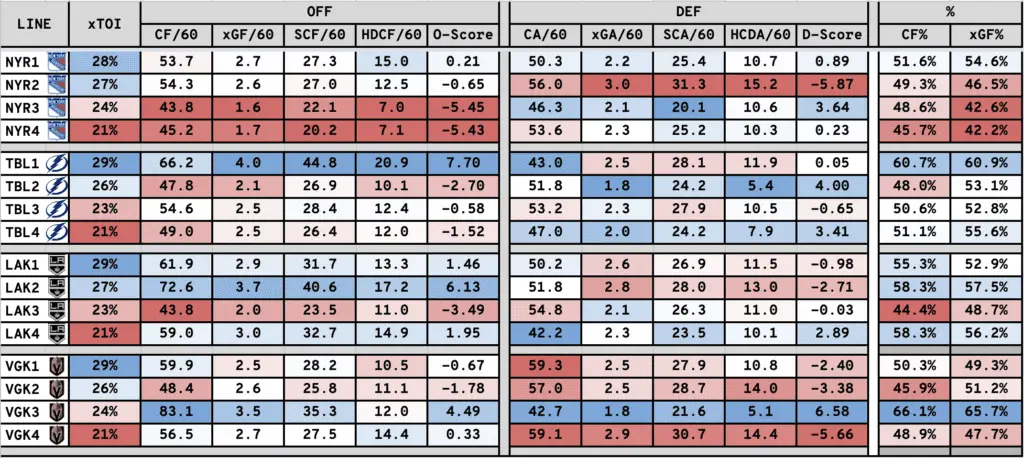
Line Stats showcase every line’s offensive and defensive metrics. O-Score and D-Score represent all of the metrics in one number weighted against the other lines on the slate. The higher the O-Score, the better that line is offensively. The same goes for D-Score. You want to target lines with high O-Scores that will face lines with negative or low D-Scores, which is represented in the Matchup Score above.
In this example, TBL1 is the best offensive line on the slate, and roughly 29 percent of their ice-time is expected to come against NYR2, which is the worst defensive line on the slate. That is a matchup that you’d expect TBL1 to dominate tonight.
5v5 Score
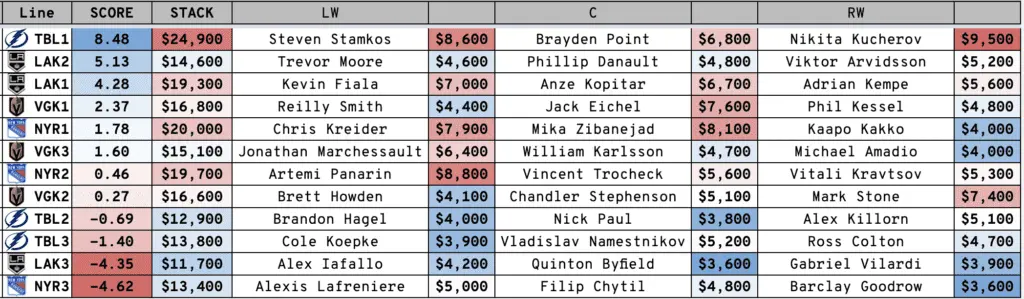
Using each line’s expected TOI, matchups and stats of both team and their opposition, we get one number: 5v5 Score. It represents which line has the best chance for high offensive output on that slate. It also includes the prices for all three players on the line and a full line-stack price.
Defensemen
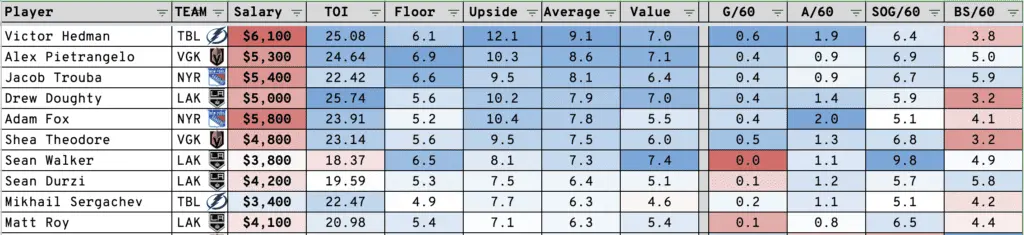
A table that displays all active defensemen expected to play on that slate and makes it easy to identify who the best plays are.
- Floor – The player’s floor is based on their shot volume and blocked shots.
- Upside – The player’s upside is based on their ability to pick up goals, assists, shots and blocked shots.
- Average – Average of their Floor and Upside.
- Value – The players’ value in relation to Average and Salary.
- G/60 – Goals per 60 minutes (all situations)
- A/60 – Assists per 60 minutes (all situations)
- SOG/60 – Shots on goal per 60 minutes (all situations)
- BS/60 – Blocked shots per 60 minutes (all situations)
Goalies
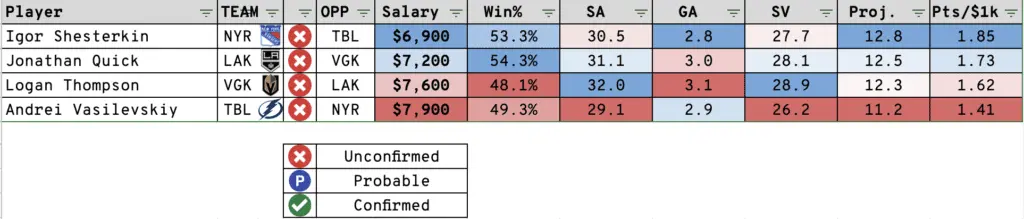
A table that displays all of the goalies that are expected to start on that slate. There is a projection based on expected shot volume and the win percentage, and implied totals that come from the sportsbook. I also display the Points/$1,000 in case you’re looking for the best value play between the pipes. And of course, we display whether the goalie is confirmed, probable or unconfirmed… we are DailyFaceoff after all.