Shot quality vs. shot quantity & the changing landscape of ‘possession’

I remember when I first started dabbling into analytics in hockey.
It came shortly after the 2013-14 season. As a Toronto Maple Leafs fan, that was a year when analytics was very polarizing in the conversations surrounding them, because they were the team defying the numbers. Under head coach Randy Carlyle, they were finding a way to win games despite some extremely lopsided shot totals.
In the “competitive” Carlyle years from 2012 to 2014, the Leafs were outshot by 7.2 shots per game, the most in the league in that span. To put it in perspective, the only other teams outshot by more than 5.0 per game in that span were the Buffalo Sabres and the Edmonton Oilers, two teams that weren’t exactly playoff contenders at that time. And yet, the Leafs had a 51-37-13 record in those two seasons, making the playoffs once in 2012-13 and then appearing to be on their way to making it again in 2013-14 until the wheels fell off when they lost 12 of their final 14 games of the season.
At the time, I would read about how that team was actually bad despite their record because they were getting outshot and think “shots didn’t matter, only goals and wins.” However, I’m not an overly stubborn person, so once the Leafs lost the way they did towards the end of 2013-14, I figured that those naysayers were probably on to something and I should learn a thing or two about the analytics that were available to us.
One thing was driven into me very clearly: more shot attempts means more shots on net, which means more chances for goals, which means more goals. The logic was pretty easy to grasp, and now I understood why everyone kept doubting Carlyle’s Leafs. Even though they were scoring and not allowing goals, the process behind those results was lucky and unsustainable, especially with the high shooting and save percentages that they had, and they needed to get better at possessing the puck to consistently create chances and goals.
So from that point on, I saw hockey in a whole new light. I’d not only care about whether a team won or lost, but I’d look into the trends under the hood and see which teams were over- and underperforming for the wrong reasons.
It also changed how I evaluated players. No longer did everyone fall under a blanket of “they’re probably good in their role because why else would they be there?” I had loads of data at my disposal to tell me which players were creating and preventing shots and shot attempts and which players weren’t. I also no longer saw players making really egregious turnovers as a completely bad thing, as it was actually an instance of looking to make the high-upside play to move the puck up the ice instead of a safe chip off the boards that almost always resulted in the other team getting the puck, albeit in a less dangerous situation.
Of course, how games were evaluated and which information was more important to consider changed as the information itself changed. In the second half of the 2010s’, expected goals entered the conversation, and now we had a way to see which shot attempts had more value than others, and which teams were creating more scoring chances. Not only that, but it also meant we had better tools to evaluate goaltenders and recognize their ability to save more difficult chances consistently – or whether they were benefitting from a strong defensive system (Oh, what I would do to see prime Martin Brodeur’s goals saved above expected).
That’s been an important development for analytics because the results have also started to change. After that 2013-14 season that first got me into analytics, teams were only scoring an average of 2.74 goals per game. In 2023-24, that’s climbed all the way up to 3.11, which is around the level that it’s been for the past three seasons. Scoring chances are now even more important because scoring is even more important.
That also means that shooting talent is also very important when building teams. You can possess the puck all you want, but if you can’t finish your chances, you’re going to hit a bump in the road eventually.
No team better exemplifies that than the Carolina Hurricanes. Ever since Rod Brind’Amour took over as head coach in 2018-19, the Canes have turned into one of the top possession teams in the league and been a consistently strong team in the regular season. In those six years, they’re first in 5v5 shot attempt share, 5v5 expected goal share, and in shot differential per game played, and all three are by a wide margin.
And yet, that hasn’t translated to playoff success. They’ll win a playoff round or two, but they usually flame out by the end of the second round or advance to the Conference Final and get swept. Some of that is due to their aggressive forecheck style eventually wearing down on the players and creating fatigue, but some if it can also be attributed to their inability to finish.
In that same six-year time span, they rank second last in shooting percentage, a stat that would normally indicate that they’re experiencing bad luck based on what most analytics told us 10 years ago. But, when it’s a trend for more than a couple seasons, nevermind six, it usually indicates a lack of finishing talent on the team.
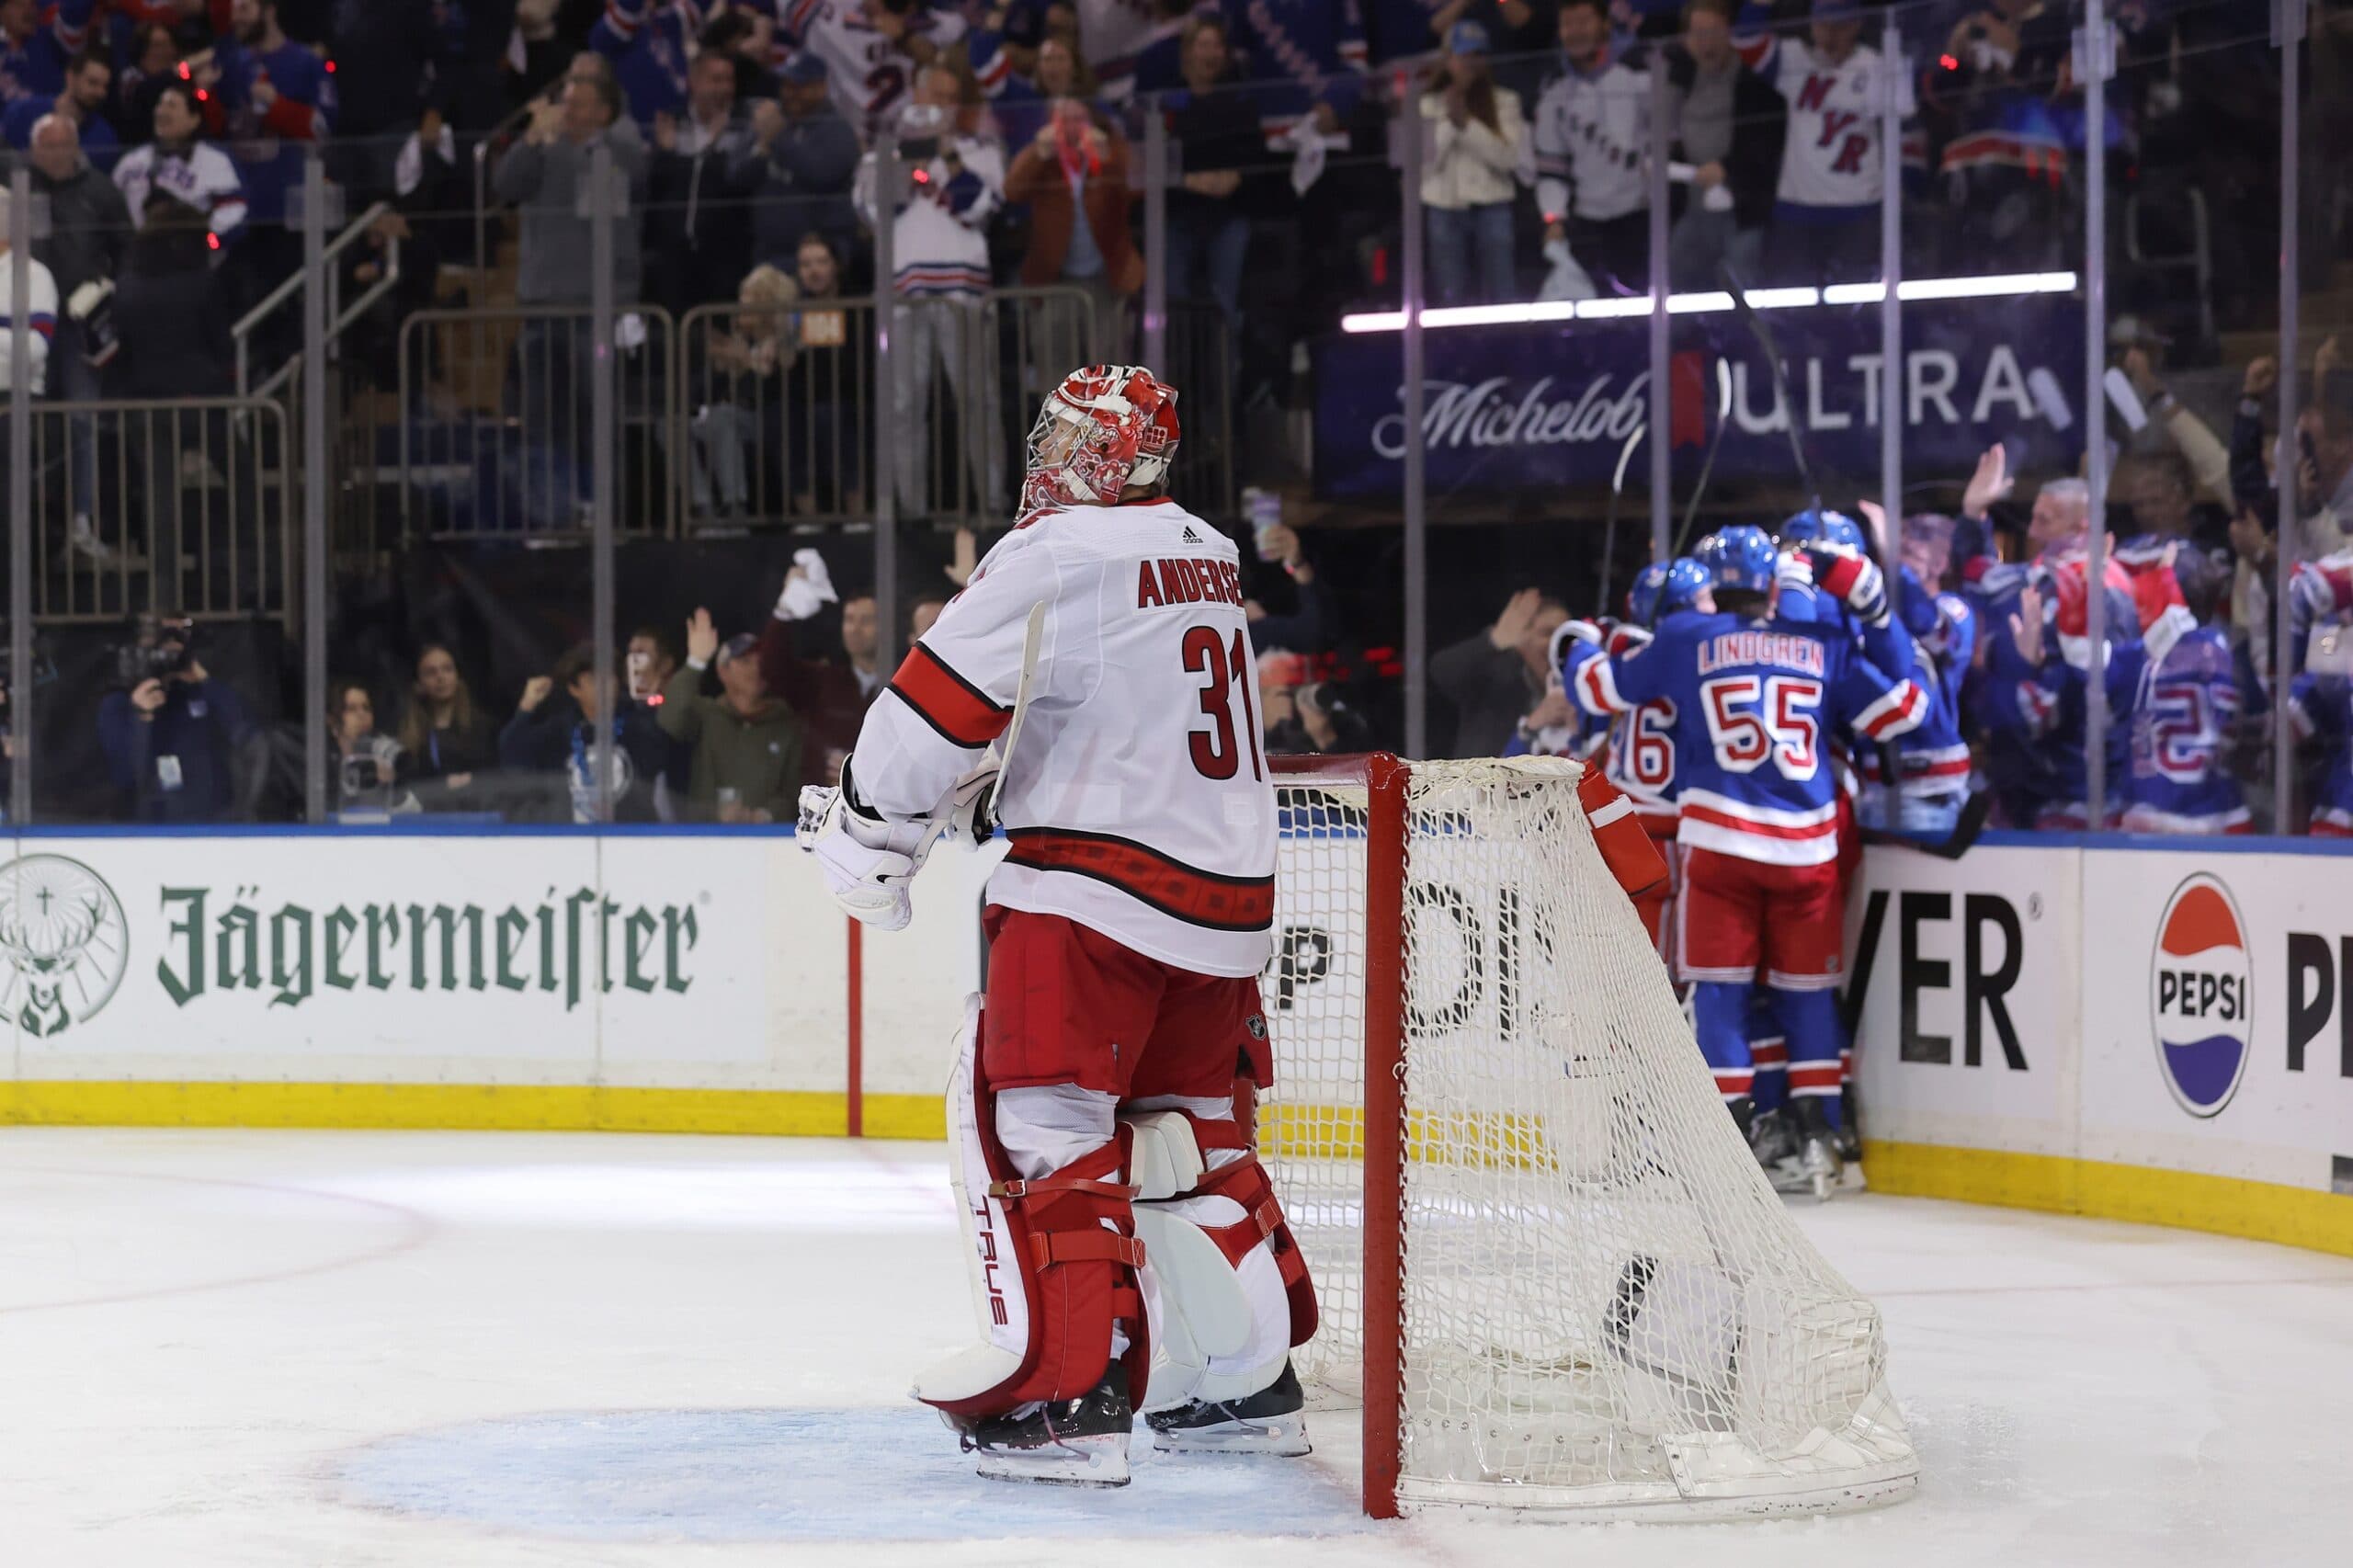
So when the Hurricanes face a team like the New York Rangers in the playoffs this season, who were the second-worst playoff team in 5v5 expected goal share this season, it would seem like that’s a walk in the park. But a team like the Rangers is a surprising kryptonite to the Canes, and that was showcased in their second-round series defeat.
Looking at the stats used for the earlier thought process of shot attempt-based possession, the Hurricanes did well in the six-game series, outshooting the Rangers 169-122 at 5v5 and having a 5v5 shot attempt share of 55.34%. You would think that translates to expected goals, but it’s not always linear. The Hurricanes still had the advantage, but it was much smaller to the point where it was basically a coin toss of 51.74% at 5v5, or a final “expected goal score” of 14.47-13.49. For the record, the final 5v5 goal totals were 13-12 for the Canes, which is quite close to the expected results.
That also is showcased in the game-by-game results.
| Game | 5v5 Shots | 5v5 Shot Attempts | 5v5 Expected Goals | Final Result |
| Game 1 | 19-14 NYR | 51-39 CAR | 1.74-1.29 NYR | 4-3 NYR |
| Game 2 | 44-28 CAR | 92-75 CAR | 3.58-3.22 CAR | 4-3 NYR |
| Game 3 | 31-16 CAR | 59-33 CAR | 2.04-1.77 CAR | 3-2 NYR |
| Game 4 | 28-22 CAR | 62-49 CAR | 3.26-2.43 CAR | 4-3 CAR |
| Game 5 | 24-15 CAR | 58-42 CAR | 2.11-1.72 CAR | 4-1 CAR |
| Game 6 | 28-22 CAR | 63-51 NYR | 2.62-2.19 NYR | 5-3 NYR |
In just about every game, the Hurricanes led (and usually dominated) in 5v5 shots and shot attempts. However, the 5v5 expected goals battle was a lot closer, with the Canes only having a decisive advantage in that regard in Game 4, which they won. When you combine that with the fact that the Rangers have the better finishing talent, especially at the higher end of their lineup that can also do damage on the power play, it’s easy to see how the Rangers got the best of Carolina in this series despite the fact that we’d see some lopsided shot totals in some games.
Have the Rangers finally found a way for the “hockey men” to trump analytics? Of course not. Eventually a team with good finishing talent and poor possession metrics will come across a team that has both good finishing talent and strong possession metrics, and suddenly quantity becomes more important when the quality is the same between both teams. It just means that when up against teams that are strong possession teams but can’t finish, it becomes a bit more of a coin flip than it would have been in past years.
In fact, just two years ago, a similar Rangers team ousted the Canes in the second round in similar fashion. But then they met a Tampa Bay Lightning team in the following round that could go toe-to-toe with them in terms of finishing but would overwhelm them with possession to get more chances.
The Rangers aren’t the only example. That same 2021-22 season also saw the St. Louis Blues shoot the lights out with the third best offense despite poor underlying numbers, and some thought we were witnessing a team that had perfected the art of passing off shot attempts until they found the perfect scoring chance. While that method worked against the Minnesota Wild in the first round, it had significantly less success in the second round against a Colorado Avalanche team that could keep up with them on the scoreboard and dominate possession. The Blues have since struggled to even make the playoffs.
What this slight shift in dynamic does mean is that just being good at possession and having good shot and shot attempt metrics isn’t as important anymore. Goals are scored at a higher rate, so focusing your efforts on getting the better scoring chance and accumulating the players to finish those chances is just as important as maintaining possession.
Getting one chance with a 50% success rate is probably more important in today’s NHL than getting 10 chances with a 5% success rate. Even though the shot attempts in this scenario may be 10-1, both situations result in 0.5 expected goals, and only one of those attempts had as much of a chance of going in the net as it did being stopped or missing.
_____
Recently by Scott Maxwell
- Stanley Cup Playoffs Day 34: McDavid and Oilers take Game 1 in double OT thriller
- Dallas Stars vs. Edmonton Oilers: 2024 Stanley Cup playoff series preview and pick
- Stanley Cup Playoffs Day 31: Oilers stave off late rally to advance to West Final
- Stanley Cup Playoffs Day 29: Oilers stars shine in 5-1 blowout to force Game 7
- Stanley Cup Playoffs Day 28: Panthers, Stars advance to Conference Finals with Game 6 wins
- Ranking all 20 possible team names for the Utah NHL franchise