The Cheat Sheet: December 16th, 2010


If you’re looking over the NHL betting board and want an unbiased second opinion, then scroll on down to the Cheat Sheet. A very busy computer crunched a bunch of numbers from this season and the last to produce an analytical summary of the day’s available bets. Do the numbers match with your opinions, or do they throw your predictions for a loop?
Scroll down to find out.
—
INDEX:
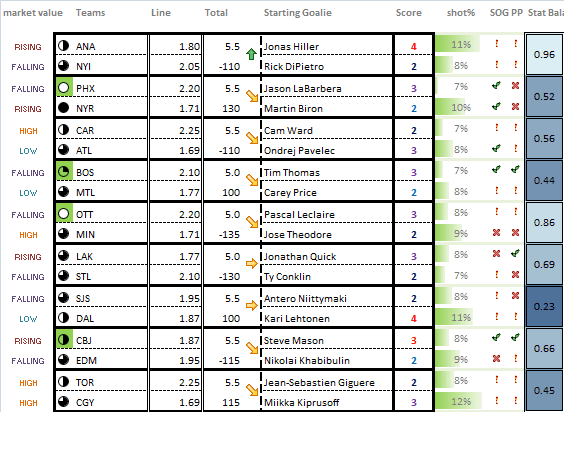
market value: This is a gauge of the team’s general play-on value. Teams that are rated ‘HIGH’ are often underrated by the betting public, and are also likely to improve on their current form. Teams that are ‘RISING’ are not likely to improve on current form, but are still offering some good betting value. Teams that are ‘FALLING’ are underperforming and not offering good value in their betting lines. Teams that are rated ‘LOW’ are being bet strongly by the betting public and are also likely due to regress from current form.
Circles: The circles indicate the strength of the play on the side relative to the other available plays on the day. A white circle indicates a highly recommendable play on the day, whereas a black circle indicates a highly not recommended play. Circles highlighted in green represent the most highly recommended plays on the day. Plays are recommended based on a team’s projected chances of winning, the line value in a team’s betting odds, and also the reliability and availability of statistics to support the recommendation (see ‘Stat Balance’).
Arrows: The arrows indicate whether the prediction favors a play on the Over or the Under. Upward arrows point to the Over, and downward arrows point to the Under. Horizontal arrows are neutral.
Score: Projected to be the most-likely score for the game. The numbers are color-scaled red-purple-indigo-blue, with red being the highest and blue being the lowest.
shot%: This is the average of the team’s projected shot percentage and the opponent’s projected save percentage.
SOG: This is a gauge of how many shots on goal a team is projected to have. A checkmark indicates a more than average amount, an exclamation mark indicates an average amount, and an “X” indicates a below average amount.
PP: This is a gauge of how well the team’s PP is projected to do against the opponent’s PK. A checkmark indicates above average, an exclamation mark indicates average, and an “X” indicates below average. The amount of PP opportunities that the team is likely to receive is also factored in, so if the team’s opponent is discipline, then success on the PP will be projected to be less likely.
Stat Balance: This is used as a gauge of how reliable the statistics used in the prediction are. The system uses statistics from both teams’ records, but it is rarely perfectly balanced, due to differences in situational games played. The closer this number is to 1.00, the more balanced the stats are for this prediction.
—
Thursday’s Cheat Sheet: (goalies and odds as of 2:00 PM ET)
An opinion or two:
– I’m issuing out a new challenge to myself today–sort of an early New Year’s resolution. Feel free to join me on my quest.
– Here is the deal: a big part of good gambling is about getting the best prices on your bets–in the long run, those little line discrepancies and decimal points really add up (just think about how much money you spend on betting in a year, and imagine winning or losing an extra 5-10% just from being a little more diligent). So, where do we find these ever-elusive ‘best prices’ then? Well, the answer to this question generally isn’t nearly as clear as the answer to the question ‘where don’t we find the best prices?’–which actually happens to be very clear.
As sports bettors, we will almost never find good prices with heavily-backed teams or public plays, and we will almost always find even worse prices with publicly-backed underdogs. This conclusion follows a very simple logic. Why would Vegas ever be so generous to offer us a fair bet that they know that 80% of the betting public is going to be taking, when they know that they can offer us an unfair bet that most of us will still take anyway? While it may be true that sportsbooks often look for balanced action when they set their lines, it also happens to be true that they often don’t get balanced action at all, and it would probably be naive of us to think that they actually don’t profit from these situations as well.
To put it simply, Las Vegas oddsmakers know a lot more about us than we do about them–they know our tendencies and they know our thought patterns (which is pretty much how they earn their paychecks). If sportsbooks can offer us Boston +100 instead of Boston +110, knowing that a majority of us are still going to take it, then that’s what they’re going to do. If Boston wins the game, the books save themselves about 10% in payout money, and if Boston loses–well, hardly anybody bet against Boston anyway (no bets to really payout). Therefore, the public doesn’t win, even when they win (because the books already took 10% of their equity and pocketed it before they even released the line).
-So, what am I gonna do differently now? Well, the computer might not be able to tell me who the public is betting on, but that information is certainly not hard to find. From now on, I will no longer be betting or recommending publicly-backed plays, regardless of how “good” they look. I don’t care if it looks like the biggest mismatch in the history of sports, if I see 80% action on one side and a line that looks too good to be true I will run for the f***ing hills!
The only bets that I’m looking for now are either ‘fade-the-public’ bets or ‘under-the-radar’ specials (Florida Panthers vs. Atlanta Thrashers, where the attendance is about 4,000 people–half of whom got free tickets–and where most sports bettors minds momentarily go blank after seeing the game on the board).
– An opinion or two? Yeah, I’ll give my opinion after the public tells me exactly how the books are gonna rob them blind again today. Who is with me?!
—