Do you still have to be an Analytics Darling to win the Stanley Cup?


Think you know sports? PointsBet Canada is live in Ontario!
_____
Can a Stanley Cup winner be distilled into a repeatable recipe?
It’s a question I ask every year after the NHL Trade Deadline passes as we reassess the league’s power structure based on which players changed teams. Is there a set list of ingredients a contending team can seek out and sprinkle into one pot every season to ensure a deep playoff run?
Last season, I laid out what I believed was a usable championship recipe by studying the previous 10 Stanley Cup winners. The recipe consisted of seven characteristics that were most common among the champions. It wasn’t as simple as just being good at everything. For instance, there wasn’t a strong correlation at all between having a good power play and winning the Cup, but there was a strong correlation between having a good penalty kill and winning the Cup.
Using the same parameters, which NHL roster has just the right mix of championship material this season?
Today, we continue the recipe series by looking back on a breakthrough that began roughly a decade and a half ago when shot-attempt data started to enter the mainstream.
Stanley Cup Ingredient #4: Shot-Attempt Share
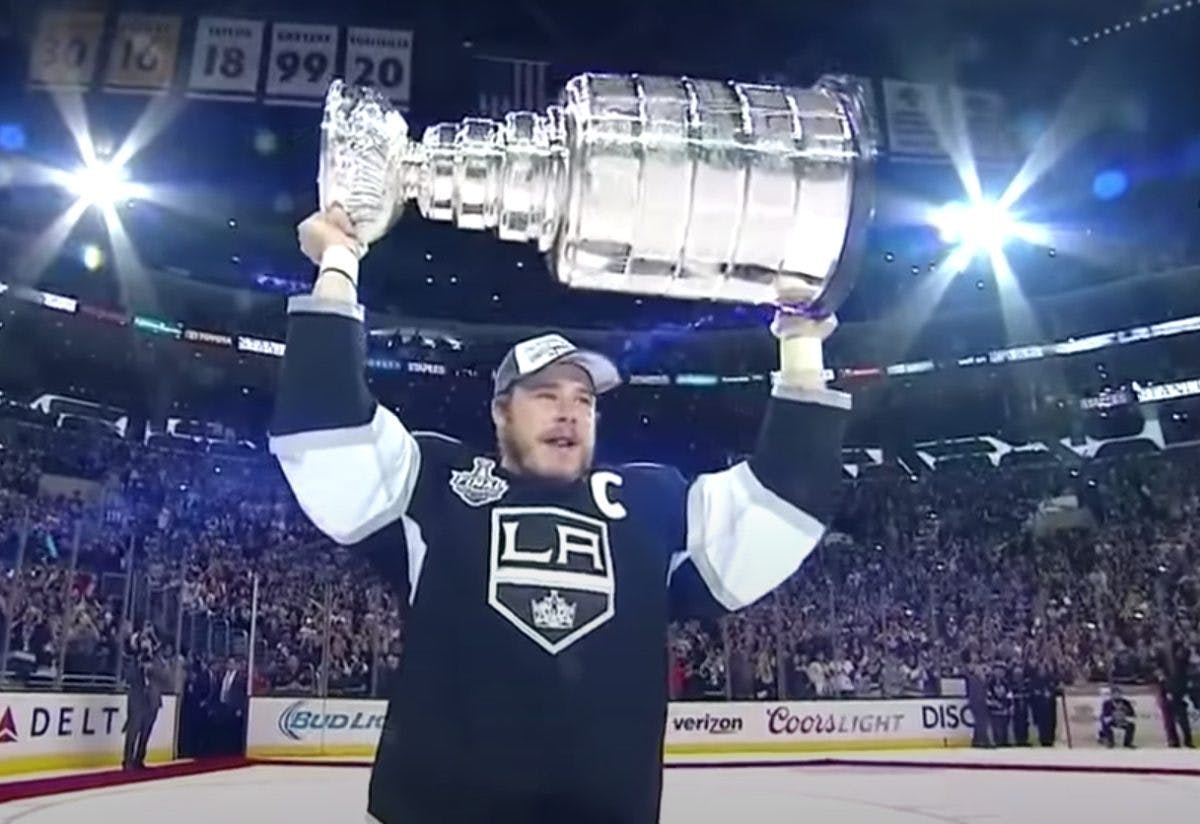
When the Chicago Blackhawks and Los Angeles Kings were alternating Stanley Cup victories, analytical thinkers began pointing out the correlation between shot attempt share – Corsi – and dominant NHL teams. We’ve since made significant strides in identifying more complex and accurate ways to track on-ice events and better paint a picture of how teams win hockey games. And yet: the correlation between Corsi, the stat that started it all for hockey analytics, and Stanley Cups is still something to behold.
Here’s a look at the past 10 champions and how they ranked in 5-on-5 shot attempt share during the seasons in which they went all the way.
| Season | Champion | CF% |
| 2012-13 | Chicago | 54.14% (4th) |
| 2013-14 | Los Angeles | 56.82% (1st) |
| 2014-15 | Chicago | 53.60% (2nd) |
| 2015-16 | Pittsburgh | 52.72% (2nd) |
| 2016-17 | Pittsburgh | 50.15% (16th) |
| 2017-18 | Washington | 47.95% (24th) |
| 2018-19 | St. Louis | 51.50% (10th) |
| 2019-20 | Tampa Bay | 52.25% (5th) |
| 2020-21 | Tampa Bay | 52.37% (9th) |
| 2021-22 | Colorado | 52.86% (7th) |
Eight of the past 10 champions have ranked top-10 in shot attempt share, and five have ranked top five. Only one has ranked in the bottom half of the NHL. So we can talk about Corsi as an oversimplification by today’s standards or how players can game the system with meaningless shot attempts, but the correlational data tells us the Stanley Cup champion is almost always a team that, in the larger regular season sample size, had the puck more than its opponent.
That said: it doesn’t seem like you need to be elite in this stat anymore – mainly that you need to be good. Six of the past 10 Cup winners were outside the top five in CF%.
Stanley Cup correlation: Strong
So if we acknowledge that, in the past 10 years, 80 percent of the champions were top-10 in regular season shot attempt share, there’s something to glean from examining who sits top 10 this season, right?
2022-23 NHL leaders, 5-on-5 CF%
1. Carolina Hurricanes, 60.34%
2. Calgary Flames, 57.00%
3. Florida Panthers, 54.50%
4. New Jersey Devils, 53.91%
5. Seattle Kraken, 52.13%
6. Los Angeles Kings, 51.95%
7. Colorado Avalanche, 51.92%
8. Buffalo Sabres, 51.74%
9. Edmonton Oilers, 51.72%
10. Pittsburgh Penguins, 51.68%
On one hand: OK, seven of these 10 clubs are in playoff positions, and the other three are in the hunt. Not surprisingly, there are zero bad hockey teams in the top 10. On the other hand: several powerhouses fall short of the top 10 in shot-attempt share, including the Boston Bruins (15th), Toronto Maple Leafs (14th) and Dallas Stars (12th), though each of them sits in the top half of the league, within striking distance of cracking the top 10 by season’s end. The bottom of the shot-attempt-share standings reads like the Connor Bedard lottery watch. Only two teams currently in playoff positions sit outside the top 20 in shot-attempt share: the New York Islanders (21st) and Vegas Golden Knights (23rd). Not coincidentally, they both crack the top 10 in save percentage. Good goaltending has masked their struggles at driving the play 5-on-5.
The Hurricanes and Devils have been dominant teams all season long and seeing them near the top of the CF% rankings supports their cases as contenders, albeit the Canes are not nearly as threatening without Andrei Svechnikov. But the scariest teams on the list: Edmonton and Colorado, who are driving the play and also boast enviable collections of superstar-grade talent.
Previous Stanley Cup Ingredients entries: Team Weight, Top-10 Scorer(s). Top-10 Goalie
Next up: Penalty Killing Proficiency
_____
Recently by Matt Larkin
- No stud goaltender? No Stanley Cup
- How hard is it to win a Stanley Cup without an elite scorer?
- How much does size matter when trying to win the Stanley Cup?
- Connor McDavid is lapping the field like no player since Wayne Gretzky
- 2023 NHL Trade Deadline winners and losers: Showtime on Broadway
- Grading the Patrick Kane trade: No leverage, no choice for Blackhawks, who do right by him
- The ‘Take less money to win’ era is over in Boston. And that’s OK
- Re-signing Dylan Larkin was a must for Red Wings, no matter the cost