How often is the Presidents’ Trophy winner actually the best team?


The Presidents’ Trophy is a weird trophy. To some, it doesn’t mean anything in the grand scheme of a team’s success, especially if playoff disappointment follows. To others, it’s the true test of merit. Odds are, it’s somewhere in between.
The trophy is a great recognition for teams that have success in the regular season, but that success is not always translated to the playoffs. A few years ago, I wrote about why Presidents’ Trophy-winning teams struggle in the playoffs, and discovered it’s often an instance of a top-five team peaking too early in the season off the back of lucky bounces, with those bounces then going the other way in the playoffs. With luck playing such a key factor in these teams’ performances, it’s hard to tell if they are the best teams.
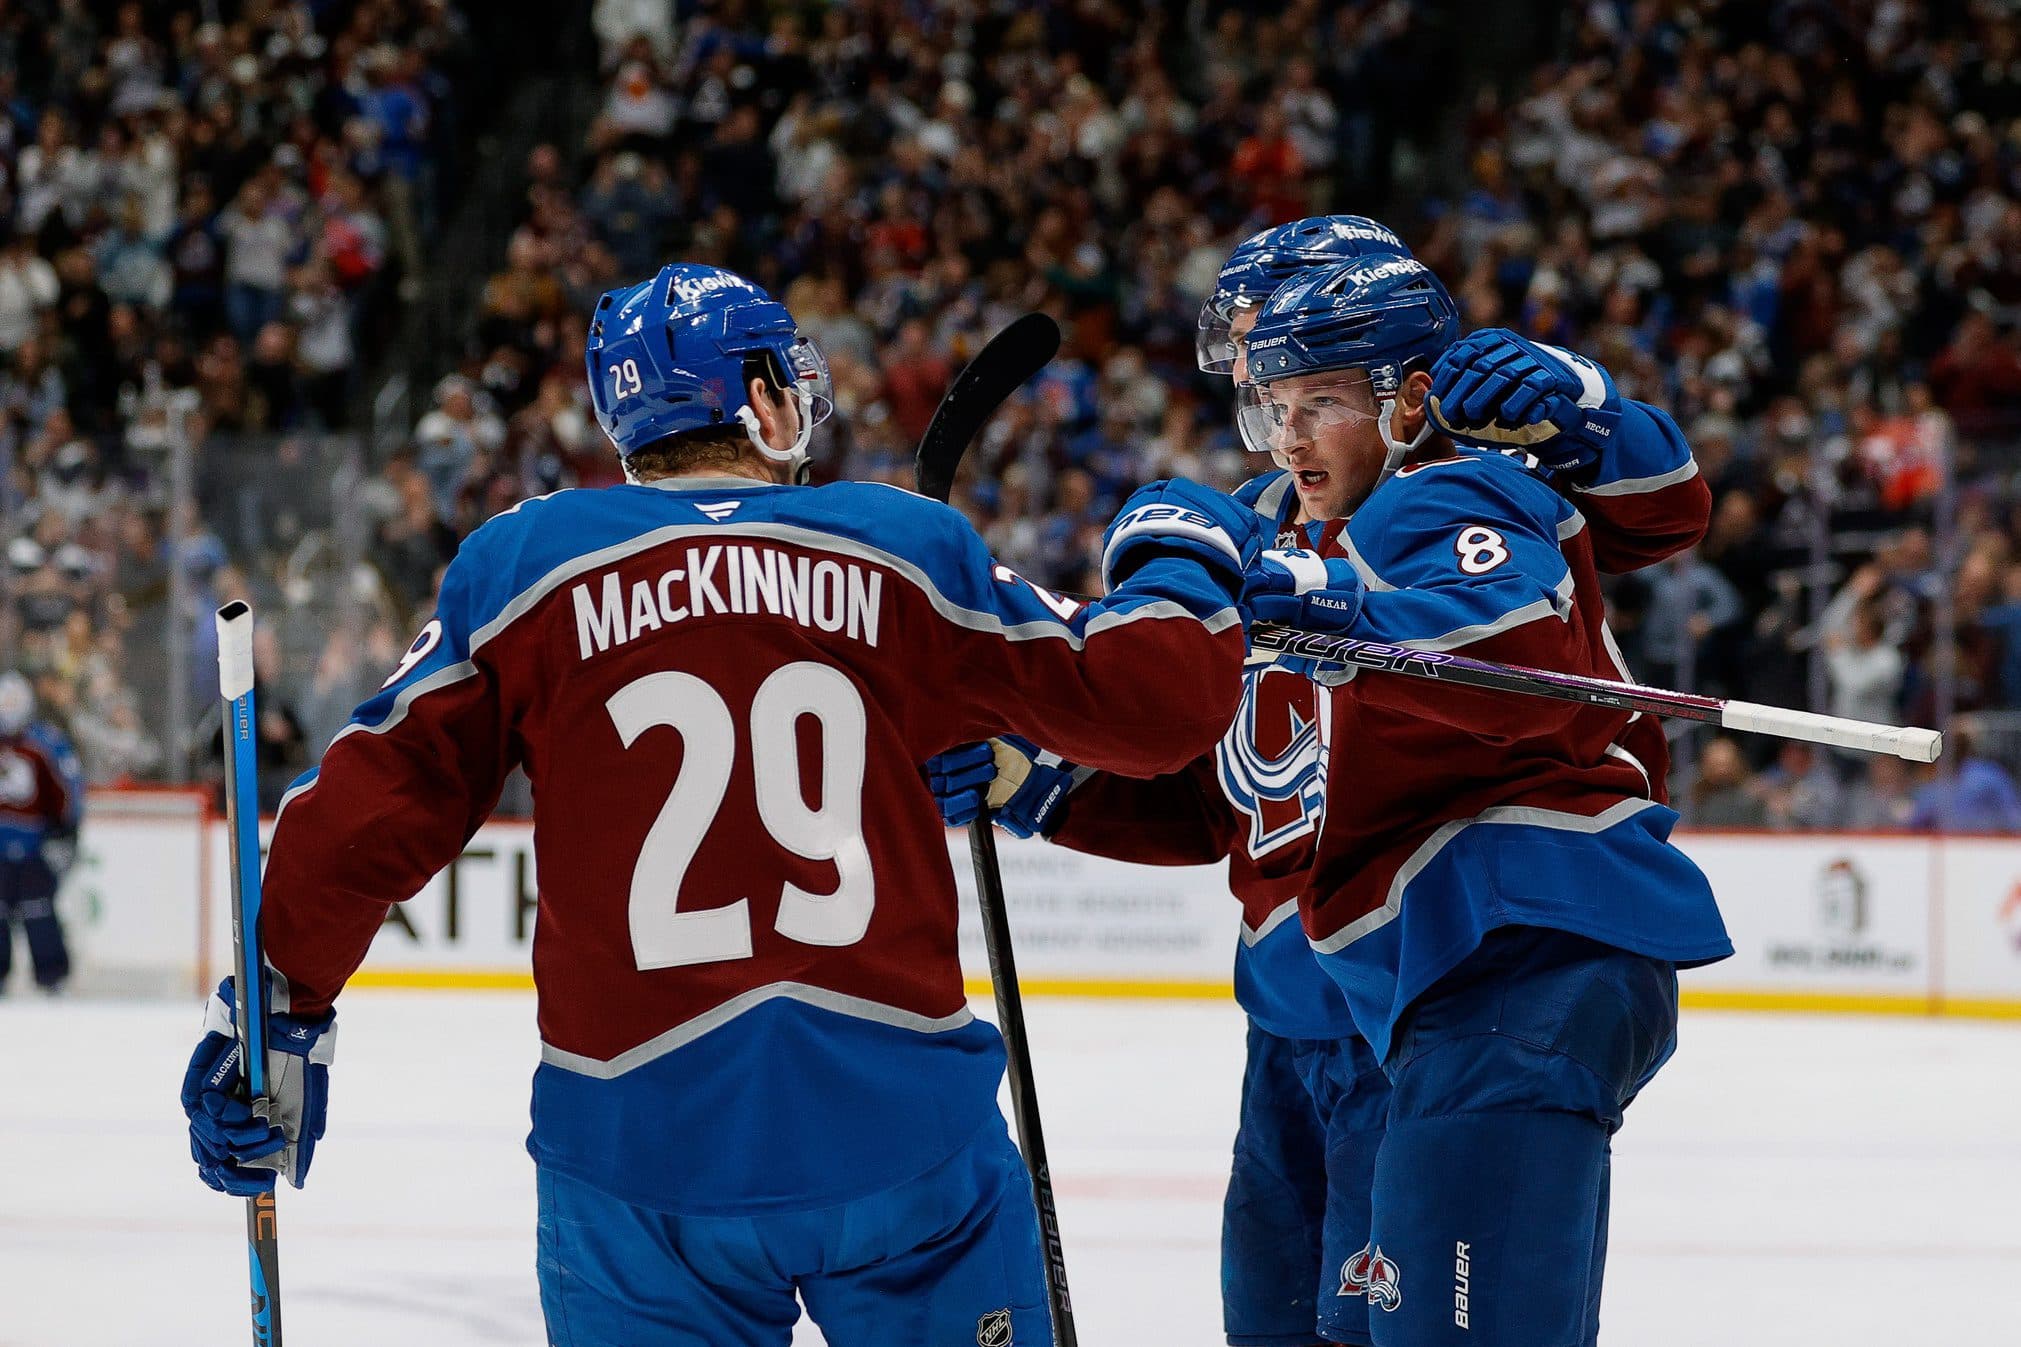
This season, we’re witnessing the Colorado Avalanche (so far) play like the best and the most successful team. The NHL doesn’t hand out trophies in December, but the Avalanche have played at an unbelievable pace with a 21-2-7 record. While a 103 PDO indicates they may take a step back at some point, they haven’t played that unsustainably, as they lead the league with a 59.33% 5v5 expected goals and a 65.27% 5v5 goal share. It’s a rare instance where the team at the top of the standings is the best team in the league, especially in the salary cap era where parity is at an all-time high.
So, how often is the team gunning for the Presidents’ Trophy actually the best team in the league in the salary cap era?
Let’s start with the obvious question: how often do Presidents’ Trophy-winning teams win the Stanley Cup? After all, it is the be-all-end-all trophy in the NHL, the one every team fights for, the designated indicator of the best team in the league.
| Seed | Cup Wins | Percentage |
| 1st | 8 | 20.51% |
| 2nd | 4 | 10.26% |
| 3rd | 3 | 7.69% |
| 4th | 6 | 15.38% |
| 5th | 4 | 10.26% |
| 6th | 3 | 7.69% |
| 7th | 4 | 10.26% |
| 8th | 2 | 5.13% |
| 9th | 1 | 2.56% |
| 10th | 1 | 2.56% |
| 11th | 1 | 2.56% |
| 12th | 1 | 2.56% |
| 13th | 1 | 2.56% |
| 14th | 0 | 0% |
| 15th | 0 | 0% |
| 16th | 0 | 0% |
Since the Presidents’ Trophy’s introduction in 1986, eight teams of the 39 to win the award have gone on to win, a 20.51% success rate. That’s the highest of any seed in the league, but it’s still not a high chance of winning the Stanley Cup. The fourth seed is catching up with six Cups, and the second, fifth, and seventh seeds have all won four. Only the 14th, 15th and 16th seeds haven’t won the Cup after the Florida Panthers became the first 11th seed to do so last season.


Cap Summary
Draft Picks
But once the salary cap era begins, things get more interesting.
| Seed | Cup Wins | Percentage |
| 1st | 2 | 10% |
| 2nd | 2 | 10% |
| 3rd | 1 | 5% |
| 4th | 4 | 20% |
| 5th | 2 | 10% |
| 6th | 1 | 5% |
| 7th | 2 | 10% |
| 8th | 2 | 10% |
| 9th | 0 | 0% |
| 10th | 1 | 5% |
| 11th | 1 | 5% |
| 12th | 1 | 5% |
| 13th | 1 | 5% |
| 14th | 0 | 0% |
| 15th | 0 | 0% |
| 16th | 0 | 0% |
In the 20 seasons of the salary cap era, the Presidents’ Trophy winner has won the Stanley Cup just twice: the 2007-08 Detroit Red Wings and the 2012-13 Chicago Blackhawks. Several other seeds have won the Cup as many times as the first seed, and the fourth seed has won twice as many as the first.
I already touched on why this is the case in my article on the Presidents’ Trophy curse. The salary cap has created more parity and bundled the top 5-10 teams together. This means a team getting lucky plays a bigger role in winning the Presidents’ Trophy or the Stanley Cup. The teams winning these awards get lucky at specific points in the season, which is why the two awards no longer correlate: it’s hard to be lucky all season.
Case in point: the 2012-13 Blackhawks’ Cup win, which came during one of the three shortened seasons since 2005. While the 2019-20 Boston Bruins and 2020-21 Avalanche proved luck can still run out after 50 or so games, the Blackhawks managed to keep the magic running long enough to last the regular season and the playoffs. Teams can’t pull off a run like that over the course of 100 games in a normal season.
All that’s to say, if we’re going off of Stanley Cup-winning teams as the threshold for success, we’re down to just two Presidents’ Trophy teams in the salary cap era. But (hot take alert), the Stanley Cup-winning team isn’t always the best team either. Much like the Presidents’ Trophy, these teams are often just one of the top 5-10 teams that manage to get the right bounces at the right time.
So what are some other ways to measure how good a team is? Let’s look at the teams who are the best at scoring and preventing goals at even strength (the state of hockey that’s most frequent and consistent to analyze). The 2005-06 Red Wings and 2006-07 Buffalo Sabres are omitted from this point forward, as the NHL’s database doesn’t track 5v5 goals before the 2007-08 season.
| Team | 5v5 GF% | League rank |
| 2007-08 Detroit Red Wings | 58.5% | 1st |
| 2008-09 San Jose Sharks | 51.93% | 10th |
| 2009-10 Washington Capitals | 61.37% | 1st |
| 2010-11 Vancouver Canucks | 56.71% | 2nd |
| 2011-12 Vancouver Canucks | 54.46% | 4th |
| 2012-13 Chicago Blackhawks | 61.34% | 1st |
| 2013-14 Boston Bruins | 61.93% | 1st |
| 2014-15 New York Rangers | 56.81% | 2nd |
| 2015-16 Washington Capitals | 55.89% | 2nd |
| 2016-17 Washington Capitals | 61.96% | 1st |
| 2017-18 Nashville Predators | 56.88% | 2nd |
| 2018-19 Tampa Bay Lightning | 56.84% | 1st |
| 2019-20 Boston Bruins | 57.69% | 2nd |
| 2020-21 Colorado Avalanche | 60.22% | 1st |
| 2021-22 Florida Panthers | 57.61% | 4th |
| 2022-23 Boston Bruins | 64.43% | 1st |
| 2023-24 New York Rangers | 50.31% | 16th |
| 2024-25 Winnipeg Jets | 59.35% | 1st |
| 2025-26 Colorado Avalanche | 65.27% | 1st |
Not surprisingly, there’s a strong correlation between scoring and preventing goals at 5v5 and winning. 10 of the 19 teams finished first in 5v5 goal share, and two weren’t in the top four – the 2008-09 San Jose Sharks and the 2023-24 New York Rangers, with both making up the difference with strong special teams.
This isn’t surprising because goals correlate with wins (obviously). If a team outscores its opponent consistently, especially at even strength, it’ll usually win. But goals also strongly correlate with luck, as the main barometer for luck (PDO) is calculated by combining shooting (a.k.a. goals for) and save (a.k.a. goals against) percentage. So if you subscribe to my theory that the Presidents’ Trophy winner is just the top-five team that is luckier than the rest, then luck will also impact their goals for and against.
So instead, let’s evaluate the winners based on the process to getting goals: shot attempts and expected goals. How often are these teams controlling play and justifiably outscoring their opponents to win games?
| Team | 5v5 CF% | League rank | 5v5 xGF% | League rank |
| 2007-08 Detroit Red Wings | 59.71% | 1st | 56.77% | 2nd |
| 2008-09 San Jose Sharks | 54.94% | 5th | 54.66% | 2nd |
| 2009-10 Washington Capitals | 54.1% | 2nd | 52.66% | 4th |
| 2010-11 Vancouver Canucks | 53.28% | 4th | 50.16% | 18th |
| 2011-12 Vancouver Canucks | 53.62% | 6th | 48.65% | 18th |
| 2012-13 Chicago Blackhawks | 55.68% | 2nd | 54.39% | 4th |
| 2013-14 Boston Bruins | 55.25% | 3rd | 54.76% | 5th |
| 2014-15 New York Rangers | 50.5% | 18th | 51% | 17th |
| 2015-16 Washington Capitals | 51.52% | 10th | 52.17% | 7th |
| 2016-17 Washington Capitals | 53.21% | 3rd | 51.46% | 9th |
| 2017-18 Nashville Predators | 52.67% | 4th | 51.49% | 11th |
| 2018-19 Tampa Bay Lightning | 52.73% | 7th | 52.97% | 9th |
| 2019-20 Boston Bruins | 51.93% | 8th | 52.82% | 5th |
| 2020-21 Colorado Avalanche | 60.32% | 1st | 60.71% | 1st |
| 2021-22 Florida Panthers | 57.22% | 1st | 56.39% | 2nd |
| 2022-23 Boston Bruins | 52.79% | 8th | 54.05% | 6th |
| 2023-24 New York Rangers | 50.45% | 17th | 48.32% | 23rd |
| 2024-25 Winnipeg Jets | 51.11% | 11th | 53.26% | 6th |
| 2025-26 Colorado Avalanche | 57.77% | 2nd | 59.33% | 1st |
With the veil of luck pulled aside, a lot of these teams don’t look like the powerhouses the Presidents’ Trophy makes them out to be. 11 of the 19 teams were outside the top five in either stat, and seven were outside the top five in both. Four teams also ranked outside the top 16 in either stat, and two outside the top 16 in both, the Rangers’ two Presidents’ Trophy wins in the salary cap era.
As far as which teams lived up to their performance, four were the best in either stat. Three finished second in the stat, they weren’t first in, while one team was first place in both – the 2020-21 Avalanche. They had the benefit of a bizarre season with 26 fewer games and played the same seven teams all season, but they had a 5.36% gap in 5v5 CF% and a 5.01% gap in 5v5 xGF% over the second-best team that year. They were on a different level, so it’s fitting the same team is doing it again this season (albeit with only a 3.4% 5v5 xG% gap).
Finally, I’ll look at one more thing: a trend I discovered almost two years ago, which indicated that since 2019, teams that finished in the top 10 in expected-goals-for and expected-goals-against per 60 minutes have won the Cup almost every time. This trend has since included the Panthers as one of those contenders in both 2024 and 2025, and they went on to win the Cup both seasons. So, how many Presidents’ Trophy winners performed at that standard?
| Team | 5v5 xGF/60 | League rank | 5v5 xGA/60 | League rank | Cup contender? |
| 2007-08 Detroit Red Wings | 2.3 | t-7th | 1.75 | 2nd | Yes |
| 2008-09 San Jose Sharks | 2.41 | 5th | 2 | 5th | Yes |
| 2009-10 Washington Capitals | 2.57 | 4th | 2.31 | 17th | No |
| 2010-11 Vancouver Canucks | 2.34 | t-9th | 2.33 | 20th | No |
| 2011-12 Vancouver Canucks | 2.15 | 18th | 2.27 | 19th | No |
| 2012-13 Chicago Blackhawks | 2.36 | t-6th | 1.98 | 7th | Yes |
| 2013-14 Boston Bruins | 2.3 | 11th | 1.9 | 4th | Borderline |
| 2014-15 New York Rangers | 2.51 | 3rd | 2.41 | t-25th | No |
| 2015-16 Washington Capitals | 2.31 | t-11th | 2.12 | t-10th | Borderline |
| 2016-17 Washington Capitals | 2.35 | 15th | 2.22 | t-8th | Borderline |
| 2017-18 Nashville Predators | 2.46 | 13th | 2.32 | t-9th | Borderline |
| 2018-19 Tampa Bay Lightning | 2.56 | 9th | 2.27 | 4th | Yes |
| 2019-20 Boston Bruins | 2.22 | 27th | 1.98 | 1st | No |
| 2020-21 Colorado Avalanche | 2.74 | 3rd | 1.78 | 1st | Yes |
| 2021-22 Florida Panthers | 3.26 | 1st | 2.52 | 17th | No |
| 2022-23 Boston Bruins | 2.81 | 10th | 2.39 | 5th | Yes |
| 2023-24 New York Rangers | 2.51 | t-21st | 2.68 | 19th | No |
| 2024-25 Winnipeg Jets | 2.66 | 8th | 2.34 | 6th | Yes |
| 2025-26 Colorado Avalanche | 3.4 | 1st | 2.33 | 2nd | Yes |
When looking at the teams through this lens, only eight of the 19 teams would have qualified as “Cup contenders” (including the two who won), four were borderline contenders (where they were top 10 in one stat and top 15 in the other), and seven were not contenders at all. Still, it doesn’t tell us which teams are “the best”, just that they’re one of the best.
Looking through all the numbers, one thing is very apparent: the Presidents’ Trophy-winning team is very rarely the best that season, based on the underlying metrics used to predict success. Not even half are considered true Cup contenders, and only a few teams are considered the best based on their on-ice performance (and not the results).
It makes how these Presidents’ Trophy-winning teams were evaluated before the playoffs look silly in hindsight, particularly the 2018-19 Lightning team who tied the league record for wins in a season, and the 2022-23 Bruins team who broke it. Both were unstoppable juggernauts according to the average hockey fan or media member at the time, and yet they weren’t even in the top three in a lot of stats used to predict future success. It goes to show if you tune out the noise that is goals and wins, these teams aren’t as unbeatable as you think, and the Columbus Blue Jackets and Panthers proved just that.
It also goes to show how special it is when someone like this year’s Avalanche squad is a top-flight NHL team. Colorado has only played 29 games, so they have a ways to go before winning the Presidents’ Trophy, and a couple of teams are already starting to close the gap on them. But it’s fun watching a team win non-stop, put in the work to earn it, and not rely on a hot power play or an elite goaltending performance to bail them out.
All the Avalanche need to do is not burn themselves out too soon.
PRESENTED BY OFF THE ROSTER

Introducing Off The Roster—Toronto Sports, Unfiltered! Toronto sports fans, your new favourite convers
_____
Recently by Scott Maxwell
- Which players could kick off the NHL trade market this month?
- Who are the most effective physical players in the NHL?
- Ranking the likelihood of 2014 Olympians returning for 2026
- Nick Robertson is finally getting bigger opportunities with the Maple Leafs – and he’s making the most of them
- Three teams and five players off to slow starts that won’t last
- Three teams and three players off to hot starts that won’t last